Energy Usage in the US
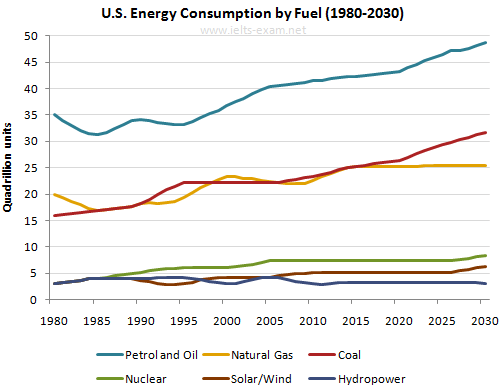
The graph illustrates from energy outlook 2008 every year about the usage of energy in USA started from 1980 to 2030. It is important to note that Petrol and Oil showed the highest consumption as well as its projection until 2030, while Natural Gas and Coal saw some fluctuations. However, three other resources experienced a steady increase with virtually some pattern over the period as a whole.
In 1980, the amount of Petrol and Oil usage stood at 35 quadrillion, but it increased gradually during 5 years and will be projected reaching a high of 49 quadrillion in 2030. In comparison to this, there were some fluctuations in both Natural Gas and Coal over 10-year period. Interestingly, the projection show a contrast difference in 2030. While Coal will incline at 36 quadrillion, Natural Gas will be stuck at 25 quadrillion.
Finally, energy from Solar/Wind, Nuclear, and Hydropower witnessed the least usage by American. Those started with the same figure at 44q, with exception nuclear which rose slowly will be predicted at 9 quadrillion in the end of period. Meanwhile, Hydropower and Solar/Wind highlighted fluctuation from 1990-2005. However, the forecast for Solar/Wind will increase slightly increase at 6 quadrillion in which Hydropower tend to fall less than one in twenty.

IELTS_Writing_Task_1.png
