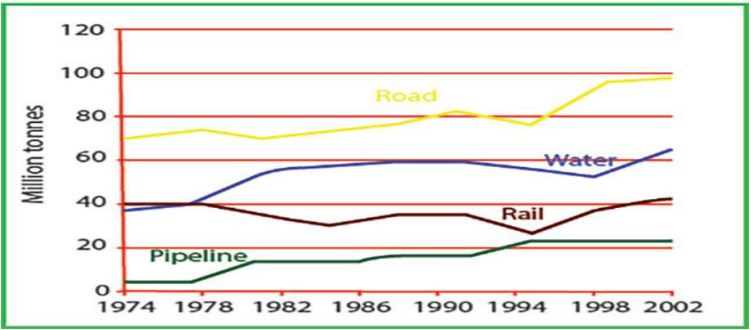
The graph below shows the quantities of goods transported in the UK between 1974 and 2002 by four different modes of transport.
The line chart shows the quantities that are transported with four different methods such as pipeline, rail, water, and road (unit in million tonnes) between 1974 and 2002 in the United Kingdom. Overall, it can be seen that the majority of the goods were transported by road while the pipeline was the least accommodation that was used to transfer the goods.
In 1974, the goods were transported by road started at 70. Between 1974 and 1990, there was a fluctuated increase and stayed at 80 in 1990. There was a slight decrease by 5 in 1995. 4-year later, the good transported increased significantly to 90 and reached a peak in 2002. For the water and rail transportation, at the beginning of the period, the rail got more goods in 40 than water that just only 3 million gaps. However, in 1998, water started to get more than the rail got. The water reached a plateau between 1986 and 1992 at 60. There was a slight decrease to 50 in 1998. Then it reached a peak in the last 2002. For the goods that were transported by rail, there was a fluctuated decrease to 30 from 1978 to 1995. Then, it increased significantly just above 40 in 2002. However. Pipeline was the unpopular one that got below 30 from 1974 to 2002.
(221 Words)

289999_1_o.jpg
