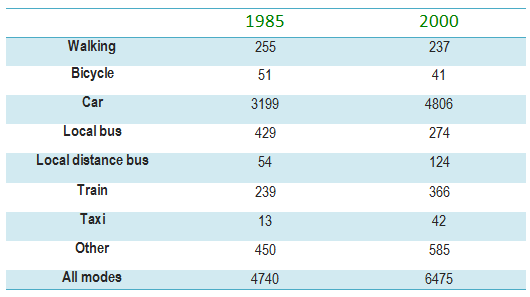
Table: Average distance in miles traveled per person
The table below gives information about changes in modes of travel in England between 1985 and 2000. Describe the information in the table and make comparisons where appropriate.
» Write at least 150 words.
The table depicts the variation in the usage of different means of transport in England in the years 1985 and 2000. The distance travelled by each type is given in miles.
Overall, mostly the number of various means of transport increased over the period. Whereas some of them such as walking, use of bicycle and local bus decreased. Moreover, cars were most popular among the people while taxis were the least favoured.
In the year 1985, the proportion of people who travelled by car was approximately three-fifth of the total. Nevertheless, the distance travelled by taxis averaged 13 miles only. The rest of the modes accounted for distances less than 500 miles.
In 2000, the distance travelled by most of the means of transport increased. With one-third increase in the use of cars and slightly less than three times increase in the use of local distance buses. However, use of some of them such as walking, bicycle and local bus declined. With almost 50% decrease in the distance travelled by local bus.

23.png
