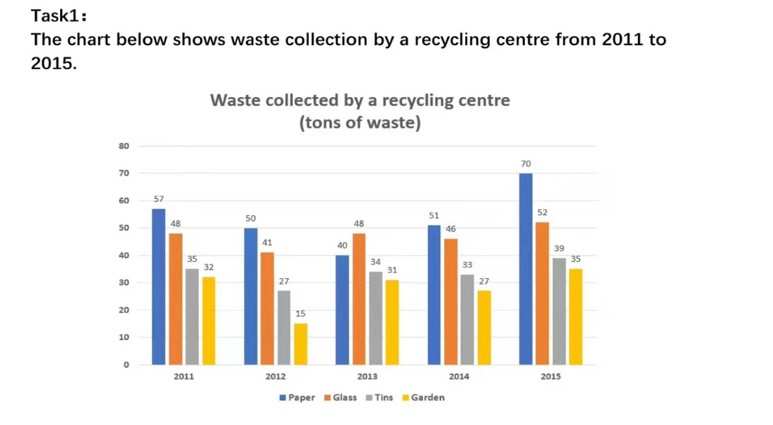
The given bar chart illustrates the amount of trash collected by a recycling center between 2011 and 2015. As can be seen from the graph, there are four materials that are mentioned in the chart. Among them, paper is the material with the highest recycling rate in the period of 5 years. In 2011, the center had 57 tons of paper, 48 tons of glass, 35 tons of tins and 32 tons of garden waste recycled. However, all of these figures decreased significantly in the next year. The amount of waste from paper, glass, tins and garden was 50 tons, 41 tons, 27 tons and 15 tons consecutively. In 2013, aside from paper, which continued to fall from 50 tons to 40 tons, all other recycled materials experienced a rise. Two years after, the amount of materials got recycled by the center soared up greatly, for paper to reached its peak at 70 tons while it is 52 tons for glass, 39 tons for tins and 35 tons for garden waste.

graph1compressed.jp.jpg
