the total use of water in some world places
The charts below give information about the way in which water used in different countries in 2000.
Summarise the information by selecting and reporting the main features, and make comparisons where relevant.
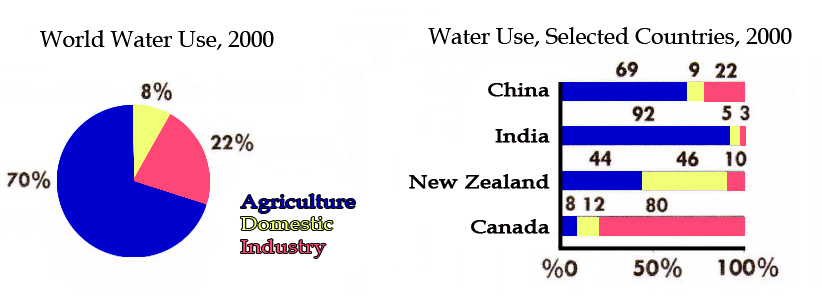
The two graphs show data on world water use, and the four nations which used it on year 2000 to three different purposes. Overall, the highest water consumption was from agriculture while the lowest was for domestic used.
The amount of the water used in agricultural purpose around the world on 2000 was at 70 %, in china the percentage was slightly low at 69 % and in india was at 92 %, and the amount of water used to domestic and industry only at 5 and 3 percent. However, in canada the highest use of water was from the industry in around 80 % and the water consumption for agricultural only at 8 percent, the case was almost similiar with the new zealand, while the water for agriculture not the biggest percentage because domestic used was 2 % high was about 46 % compared to 44 % for agricultural and 10 percent for industrial purpose.
It also can be clearly seen the total use of water use in china on agricultural and domestic used was almost identically with the total of water consumption in the world with only one percent different on both categories, the china only share the same amount with the world in term of water use for industry.
Please give me advices and IELTS score prediction

53.jpg
