You should spend about 20 minutes on this task.
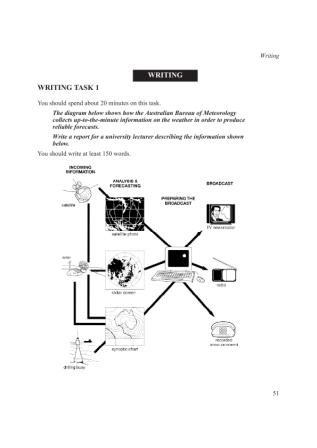
The diagram below shows how the Australian Bureau of Meteorology
collects up-to-the-minute information on the weather in order to produce
reliable forecasts.
Write a report for a university lecturer describing the information shown
below.
You should write at least 150 words.
The chart is attached
How do we get the weather forecast?
The following diagram shows all the steps in order to produce a reliable forecast.
Firstly , satellites are used as a source of collecting the information. Using such information can produce satellite photos which are sent directly to Bureau of Meteorology. Information can be gathered from radars as well and radar screen shots are also sent.
Another way of collecting information is by creating synoptic charts using satellites, radars or drifting buoys.
All inputs are being analyzed in the Bureau by experts to produce for us the daily weather forecast which we watch on TVs or hear as recorded announcements on our telephones.
They are also of great help for drivers when they hear it over the radio.

Weathertask1.jpg
