Unanswered [1] | Urgent [0]
  

Home / Writing Feedback   % width   Posts: 6


During this 25 year period, consumption of pizza and hamburgers by Australian teenagers increased


upinipin 32 / 48  
Apr 24, 2014   #1
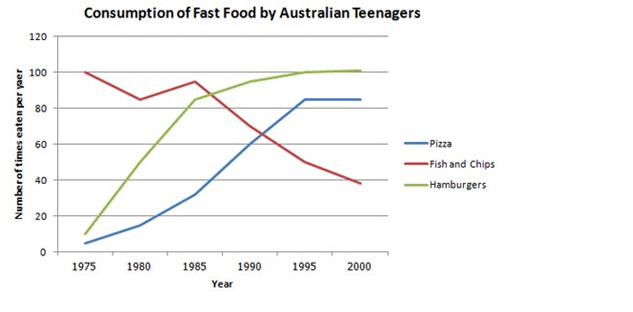
The graph shows changes in the amount and type of fast food consumed by Australian teenagers from 1975 to 2000.

During 25 years fast food consumed by Australian teenagers increase sharply specially for pizza and hamburger. But, for fish and chip decrease sharply.

Pizza line shows from 1975 to 1995 increased sharply until 82 people eaten per year. But, in 5 years latest consumed of this food leveling off about 82 people eaten per year. Hamburger line shows while 10 years raised sharply about 83 people eaten per year. From 1985 to 1995 increased steadily but in 5 years latest leveling off 100 people eaten per year.

Fish and chips line shows from 1975 to 1980 decreased steadily and then increased step by step in 5 years. Then, from 1995 to 2000 decreased sharply about 40 people eaten per year.

Overall, Australian teenagers interested to fast food such as pizza and hamburger in each year increased. Fish and chips are not interesting fast food today's.

  • consumption_of_fast_.jpg


yuchiu 2 / 3  
Apr 24, 2014   #2
Dear upinpin:
Australian teenagers increase sharply specially for pizza and hamburger. But, for fish and chip decrease sharply .
Pizza line shows from 1975 to 1995 increased sharply
I think you could use different word replacement to illustrates the curve line, it helps to enrich the essay (e.g.rapidly,quickly,suddenly), or you can try different structure like: During 25 years the consumption of fast food in Australia has a rapid increase in pizza and hamburger.

Hope this would help you.
dumi 1 / 6793  
Apr 24, 2014   #3
The graph shows changes in the amount and type of fast food consumed by Australian teenagers from 1975 to 2000.

The graph presents information about fast food consumption by Australian teenagers from 1975 to 2000.

During 25 years fast food consumed by Australian teenagers increase sharply specially for pizza and hamburger. But, for fish and chip decrease sharply.

... this is a very good overview in terms of its contents. You have presented the main observations very well to give the reader a good picture about the total graphical presentation :)

During this 25 year period, consumption of pizza and hamburgers by Australian teenagers had a sharp increase. However, fish and chip had shown a major decline in consumption during the same period.
niesaysi 16 / 281  
Apr 24, 2014   #4
Pizza line shows from 1975 to 1995 increased sharply until 82 people eaten per year.

Take a glance at the meaning of the bold part. It really makes the reader confused. Do not misplace it. Put it closer to the one it modifies.

But, in 5 years latest consumed of this food leveling off about 82 people eaten per year.

But, in five years, the consumption of this food leveled off with about 82 people patronizing it per year.
Pahan 1 / 1824  
Apr 24, 2014   #5
.... on Y axis you get the number of times that particular food is eaten by an individual per year and not the number of persons. You have interpreted that wrong in this detailed para. This is my suggestion;

Consumption of pizza has increased steadily from 1975 to 1995 until it is eaten 82 times per year. However, in next 5 years it has maintained the same level of consumption. Hamburgers too show a steady and continuous growth in consumption for 10 years form 1975 and then this growth slows down its although it had continued to grow at a slower pace until 1995. Thereafter it had maintained the same level of consumption which is at 100 times per year.
SHanafi 120 / 357  
Apr 24, 2014   #6
During 25 years

, I prefer to use over instead of during.
Here I got from my learning book
During means 'for part of the time mentioned'. Over means ' for the whole time mentioned'

We are lucky that the book give us texamples :
Faisal stayed at the hotel for two weeks during the summer
The graph shows information about hotel staff over a ten-year period


I just read from the internet and some websites said that time phrase like over a ten-year period is a good phrase in IELTS. Perhaps you can use it in order to gain high mark.

Hopefully it helps you


Home / Writing Feedback / During this 25 year period, consumption of pizza and hamburgers by Australian teenagers increased
Do You Need
Academic Writing
or Editing Help?
Fill out one of these forms:

Graduate Writing / Editing:
GraduateWriter form ◳

Best Essay Service:
CustomPapers form ◳

Excellence in Editing:
Rose Editing ◳

AI-Paper Rewriting:
Robot Rewrite ◳

Academic AI Writer:
Custom AI Writer ◳