Unanswered [7] | Urgent [0]
  

Posts by Citra07
Name: Citra Smaradahana
Joined: Dec 27, 2016
Last Post: Dec 30, 2016
Threads: 3
Posts: 4  
From: Indonesia
School: Diponegoro University

Displayed posts: 7
sort: Oldest first   Latest first  | 
Citra07   
Dec 28, 2016
Writing Feedback / IELTS Task 1 Annual Expenses by Local Bureaucracy in Several Lands [2]

A comparison of the information about the annual expenses by local bureaucracy in several lands between 1980 and 2000 is illustrated in the pie charts and is measured by percent. Overall, higher education always the biggest portions in every decade. However, K-12 education always declines until the end of periods.

During two decades, higher education increased 10% from 35% to 45%. But, at the end of the decade, it decreased 5% and became 40%. The percentages of K-12 education slowly decreased from 25% to 18% in 2000. Expenses of environmental services were rose 1% in the first 10 years from 4% to 5% and rose again 4% in the second 10 years from 5% to 9%.

Expenses for the transportation went down in 1990 as much as 10% and climbed in 2000 reached 22%. Different from transportation, expenses for health and human resources increased in the first decade of 14% to 20%. However, in the last decade health and human resources was decline to 10%.


  • Pie_Chart.jpg
Citra07   
Dec 28, 2016
Writing Feedback / LOCAL AUTHORITIES BUDGET in different lands in 1980, 1990 and 2000. [2]

Good evening Ms. Aira, I will try to correct your writing.

The pie charts describes the mount's conversion of ...

because the pie charts is plural

... a different number of investment , it decreased slightly ...

a different number is not fit with uncountable. Consider to change it.

Thanks, glad to help you.
Citra07   
Dec 29, 2016
Writing Feedback / The prolificity of women in their forties at the antipodes [4]

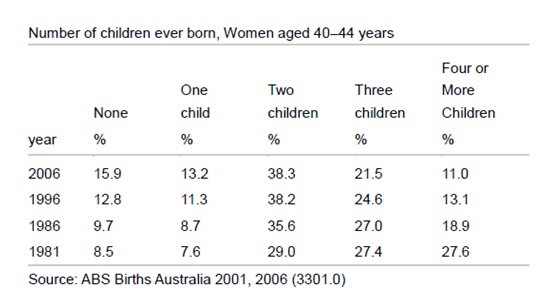
Women in aged 40-44 years who had children in Australia is reported in a table over 25 years since 1981. Overall, the woman who has no child, one child, and two children climbed for the every year. However, the other category showed decreased percentages.

In all of the period, the woman who has two children was the biggest percentages. In 1981, the data shows 29% and in the end of the period, the data showed 38.3% it describe the data increase 9.3%. The second biggest data at 1981 was the four or more children had 27.6% but in the end of the period, the data plummeted to 11%.

The data of no children and one child from the woman in 40 - 44 years was increased significantly which no children increased 7.4% from 8.5% to 15.9% and one child increased 5.6% from 7.6% to 13.2%. However, Woman had three children decreased significantly from 27.4% to 21.5%.


  • Tabel.jpg
Citra07   
Dec 29, 2016
Writing Feedback / Mothers in Australia over forty years old. Essay Writing task 1 [5]

Hallo Hana, I will try to correct your writing. I am not really good in a writing so I hope we can discuss.

I see there are many wrong about the spelling of the word and some word did not match in your writing. But I will correct your content first. I will try to give my suggestion.

In the first paragraph in the second line, you write "the women did not had baby " you can change to "the woman without child". And for this sentence " All in all, it can clearly be seen that the women did not had babyand the women had one child also the women had two children were an increase in all of period " you can make more compact like {All in all, it can clearly be seen that the women without child, with one child, and two children were an increased in all of the period}.

In the second paragraph, you write "In 1981, the women who had two children saw the highest proportion at just above 25% every year, whereas female who had one child and the women who did not have a child showed a gradual increase at less than 16% in all years". In this paragraph, you should mention the right percentages, not "just above" or "less then". And in the first paragraph, you said about the increase and decrease of the data, not the highest or lowest data. And you use "whereas" it mean you compare the woman who had 2 children and women without a child and one child, but the comparison is not right. because you compare the highest portion of data with the increased data. I will try to make a sentence for you, {In 1981, the women who had two children, one child, and none had 29%, 7.6%, and 8.5% in a row.}.

And for the third paragraph, you said "Nevertheless, the women had a three childrean in every periode from 1981 to 2006 gradualy increase from 27,4% 27,0%, 24,6%, to 21,5% " there are three words wrong spelling and about the data you should write decrease. {Neverless, the women had three children in every period from 1981 to 2006 gradually decrease from 27.4% to 21.5%}. Please be careful when you use comma and dot. for the number you should dot. (27.4%, 27%, 24.6%, and 21.5%).
Citra07   
Dec 30, 2016
Writing Feedback / IELTS Task 1 World Population and Comparison of Developed and Developing Countries [2]

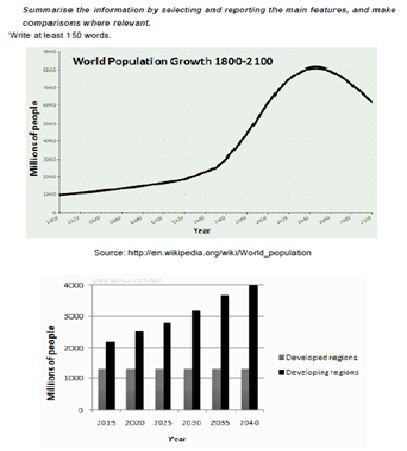
The line graph shows the particular people in the world between 1800 and 2100. And the bar chart compares the particular people of high-income countries with low-income countries over 25 years. The high-income countries have prediction steady trend until the end of the period of 2040 from 2015. However, the low-income country will increase significantly.

The particular of people in the world increased significantly from 1800 to 1960 which had 1000 millions of people in the first period to near 3000 millions of people in 1960. And in 1960 the population increased dramatically to under 6000 millions of people in 2000. Then, the prediction will get the peak number of people in 2040 for above 8000 millions of people. The last population will decrease to under 7000 millions of people in 2100.

The prediction also showed in the bar chart. The number of particular people in the developed country will always steady from 2015 to 2040 which had above 1000 millions of people in all of the years. However, the developing country predict will increase the population to 4000 millions of people from above 2000 millions of people between 2015 and 2040.


  • Line__Bar_Chart.jpg
Citra07   
Dec 30, 2016
Writing Feedback / The proportion of proficient persons in a foreign language among male and female students [2]

Hi, I will try to give you a little comment. I hope it can help you.

In the Introduction, you must write paraphrase the title of the graph. "Percentages of students proficient in a foreign language".
this is your writing "The chart illustrate the proportion ... ." you can make it more compact, {The bar chart illustrates the percentages of pupils skills at six countries of foreign language in 2016.}. You must make groups for your data. I see the chart shows there are 5 countries who woman bigger than man. You can say all of the countries or just mention the exception. For example, {China, Romania, India, Rusia and Vietnam had the bigger data of woman who had the skill of a foreign language.} or {except the Thailand, woman has more percentage than men in all countries.}. and the third sentence you can make a comparison. {However, just Thailand had a bigger percentage of men than woman.}

So, if the sentence becomes one. it will be like this.

{The bar chart illustrates the percentages of pupils skills at six countries of foreign language in 2016. China, Romania, India, Rusia and Vietnam had the bigger data of woman who had the skill of a foreign language. However, just Thailand had a bigger percentage of men than woman.}

For the second paragraph, you can the positive data about the woman or the man. But, I suggest you make the biggest first of the categories. I will make an example. {IELTS writing actual test in December 2016, has data which five countries a dominant number of woman bigger than the man.}. It can make the first sentence in the second paragraph. After that, you can mention the number of percentages of the data.

I will make a complete paragraph as a sample.

{IELTS writing actual test in December 2016, has data which five countries a dominant number of woman bigger than the man. The comparison for the woman and man in China was above 28% than above 14%. The data of woman in Romania was above 63% than 42%. The different data in India of the woman and man data was near 14% which woman near 70 and man at 56. In Rusia woman gets 42% and man get 35%. The last countries who had big data of woman bigger than man were Vietnam with percentages 56% and near 43% in a row.}

In the last paragraph, you can mention about the different data from others.
And you can make like this, {In the bar charts not only the woman got the highest percentages, but also there was one country had the man data bigger dan woman. In Thailand, the data gives information that man had near 35% and woman get near 26%.}

And my last suggestion, the data is not absolute in the line of the percentage. So, you can not mention the absolute data which not display in the bar chart. You can use near or above for making the easy writing task 1 for IELTS.
Need Writing or Editing Help?
Fill out one of these forms:

Graduate Writing / Editing:
GraduateWriter form ◳

Best Essay Service:
CustomPapers form ◳

Excellence in Editing:
Rose Editing ◳

AI-Paper Rewriting:
Robot Rewrite ◳

Academic AI Writer:
Custom AI Writer ◳