sisi999
Apr 14, 2018
Writing Feedback / Academic IELTS Writing Task 1: Movie Tickets Sales by Genre from 1980 till 2010 [3]
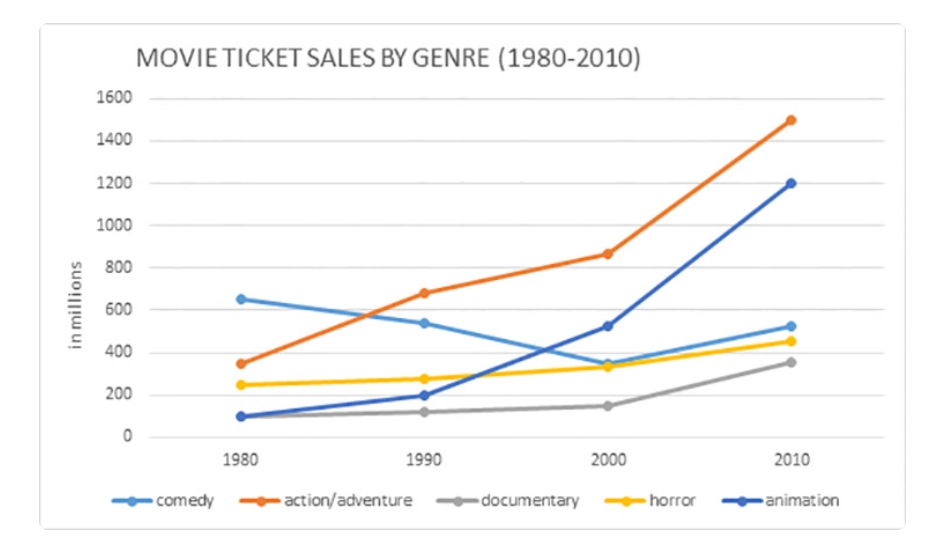
Given: The graph below shows the number of movie tickets sold around the world each year from 1980 to 2010. Ticket sales, according to genre, are presented in millions.
Summarize the information by selecting and reporting the main features, and make comparisons where relevant.
This is my answer (177 words):
The line graph presented illustrates the sum of money, in millions, spent on movie tickets, from 1980 to 2010. The movie ticket sales are grouped according to movie type. The movie types include comedy, action/adventure, documentary, horror, and comedy.
Overall, the sales, with respect to most of the movie types, have increased over the past 20 years. The sales of comedy movie tickets failed to follow this trend, as they presented an overall drop in sales. Past the year 2000, the action/adventure and animation movie tickets showcase the steepest increase in sales.
In terms of sales, action/adventure and animation movies yielded the most in the year 2010 (around 1500 million and 1200 million respectively). Documenary and horror movies also presented an increase in sales however, at a much steady pace.
On the other hand, the sales of comedy movie tickets were gradually dropping from the year 1980 till 2000. In 2010, there was a rebound (from around 390 million to around 590 million). Nonetheless, this rebound in sales was still less than the sales generated in 1980 (around 620 million).
ps. I would really appreciate a rough band score. This is my first attempt and I would like to see were I stand.
money spent for watching movies in cinemas
Given: The graph below shows the number of movie tickets sold around the world each year from 1980 to 2010. Ticket sales, according to genre, are presented in millions.
Summarize the information by selecting and reporting the main features, and make comparisons where relevant.
This is my answer (177 words):
The line graph presented illustrates the sum of money, in millions, spent on movie tickets, from 1980 to 2010. The movie ticket sales are grouped according to movie type. The movie types include comedy, action/adventure, documentary, horror, and comedy.
Overall, the sales, with respect to most of the movie types, have increased over the past 20 years. The sales of comedy movie tickets failed to follow this trend, as they presented an overall drop in sales. Past the year 2000, the action/adventure and animation movie tickets showcase the steepest increase in sales.
In terms of sales, action/adventure and animation movies yielded the most in the year 2010 (around 1500 million and 1200 million respectively). Documenary and horror movies also presented an increase in sales however, at a much steady pace.
On the other hand, the sales of comedy movie tickets were gradually dropping from the year 1980 till 2000. In 2010, there was a rebound (from around 390 million to around 590 million). Nonetheless, this rebound in sales was still less than the sales generated in 1980 (around 620 million).
ps. I would really appreciate a rough band score. This is my first attempt and I would like to see were I stand.

The graph given
