amy_nyk
Mar 11, 2020
Writing Feedback / The data of an average Australian household electricity use and heat-trapping coal emissions CHARTS [2]
written by Amy Ng
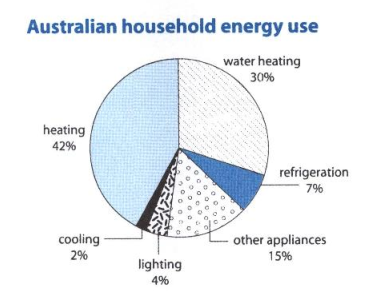
The charts depict the data of an average Australian household electricity use and heat-trapping coal emissions.
Overall, since most Australian people consume energy in heating and water-heating, the emissions are high percentage. Cooling and lighting takes fewer energy. Therefore, there are less emissions.
Firstly, heating and water heating are the most used in Australian households, which are 30% and 42%. Next, 15% of residents use energy in other applications. Last, refrigeration, cooling and lighting take the lowest energy, which is under 10%.
Secondly, the highest percentage of greenhouse gas emissions is water-heating. And then other appliances are 28%. Refrigeration and heating have similar gas emissions, which are 14% and 15%. Finally, cooling and lighting also are under 10%, which is 3% and 8%, analogous to the first chart. It also highlights that there is tight relationship between energy usage and greenhouse gas emission.
**the chart is included in file 1.**
Please leave some comment. Thank you.
IELTS Cambridge 10 Test 1 Writing Task 1
written by Amy Ng
The charts depict the data of an average Australian household electricity use and heat-trapping coal emissions.
Overall, since most Australian people consume energy in heating and water-heating, the emissions are high percentage. Cooling and lighting takes fewer energy. Therefore, there are less emissions.
Firstly, heating and water heating are the most used in Australian households, which are 30% and 42%. Next, 15% of residents use energy in other applications. Last, refrigeration, cooling and lighting take the lowest energy, which is under 10%.
Secondly, the highest percentage of greenhouse gas emissions is water-heating. And then other appliances are 28%. Refrigeration and heating have similar gas emissions, which are 14% and 15%. Finally, cooling and lighting also are under 10%, which is 3% and 8%, analogous to the first chart. It also highlights that there is tight relationship between energy usage and greenhouse gas emission.
**the chart is included in file 1.**
Please leave some comment. Thank you.

Capture.png
