xl98758
Dec 11, 2020
Writing Feedback / WRITING TASK 1: LINE GRAPH; the average number of Vietnamese students study in 3 different country [7]
the proportion of Vietnamese learners studying in different countries
Please give me some advice for my essay, thank you very much in advance.
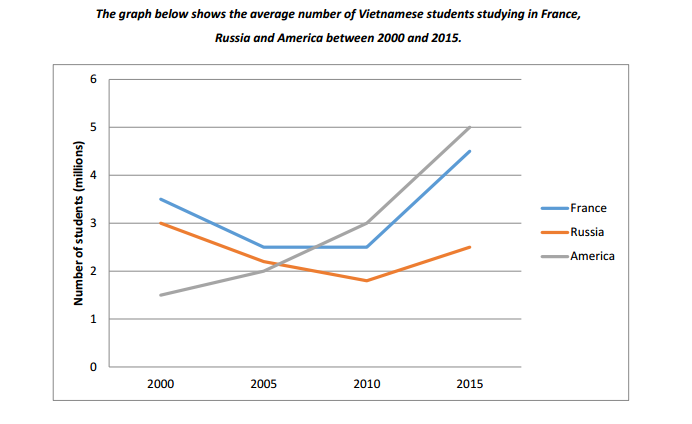
The line graph compares the average figure of Vietnamese international students learning in three different countries from 2000 to 2015.
Overall, the proportion of Vietnamese learners studying in the US and France increased significantly, while a slight drop in students in Russia. Also, the figure for international students in the US is the highest.
In 2000, the number of Vietnamese students studied in France reached a peak, at more than 3,5 million, in comparison to 3 million in Russian and 1,5 million in American. Over the next five years, the proportion of international students in France and Russia declined to around 1 million, whereas going to America rose to more than 2 million.
In 2005, there was a substantial growth stand at 5 million in 2015. By contrast, the number of students increased by 2 million during this period. In the year 2010, the proportion of international learners hit the lowest point under 2 million. On the contrary, It was going up to 2.5 million at the end of the period.

This is a picture
