Sally_Dao
Jun 14, 2021
Writing Feedback / Task 1: Relationships at work with supervisors and companions (survey of workers 2005 and 2009) [2]
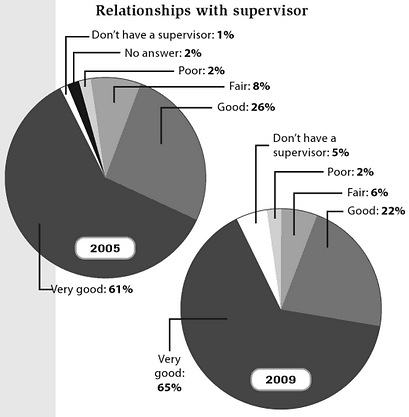
The given pie charts illustrate two relationships at the workplace of the employees between 2005 and 2009. Overall, as is observed, both relations with supervisors and companions turned out well.
According to the pie charts, there was a slight increase in the number of laborers that don't have administrators at work, 4% higher than the last 4 years. The poor communication remained stable at 2% meanwhile the normal one fell to 60% in 2009. The relationship status between employees and supervisors became better, 65% workers answered they had pretty good contact with the managers.
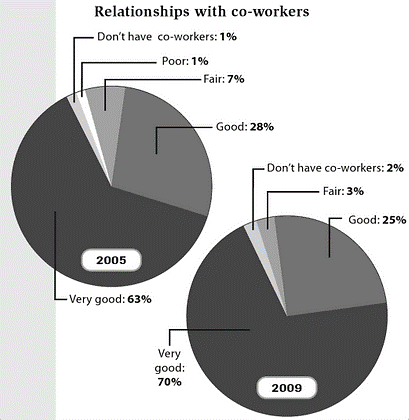
The same trend was true for the relations with co-workers. In 2009, there was no poor relationship and the fair relationship witnessed a decline with the figure estimated at 3%. In addition, the number of employees who felt pleasure with their associates grew up to 70%, 7% higher than that in 2005.
Writing task 1: Relationships at work
The given pie charts illustrate two relationships at the workplace of the employees between 2005 and 2009. Overall, as is observed, both relations with supervisors and companions turned out well.
According to the pie charts, there was a slight increase in the number of laborers that don't have administrators at work, 4% higher than the last 4 years. The poor communication remained stable at 2% meanwhile the normal one fell to 60% in 2009. The relationship status between employees and supervisors became better, 65% workers answered they had pretty good contact with the managers.
The same trend was true for the relations with co-workers. In 2009, there was no poor relationship and the fair relationship witnessed a decline with the figure estimated at 3%. In addition, the number of employees who felt pleasure with their associates grew up to 70%, 7% higher than that in 2005.

Picture1.png
Picture2.png
