Unanswered [8] | Urgent [0]
  

Posts by hongnguyentp92
Name: Hong Nguyen
Joined: Jan 9, 2017
Last Post: Feb 27, 2017
Threads: 1
Posts: 5  

From: vietnam
School: Academy of Finance

Displayed posts: 6
sort: Latest first   Oldest first  | 
hongnguyentp92   
Feb 27, 2017
Essays / Help with guidance in Health Issues essay report [3]

In my opinion, you may list question involved your plan and conduct a survey with small groups like:
1. Do you want to exercise? Most people will answer yes
2.Are you exercising? Why yes why no?
3.If the city has a lifestyle center, would you like to come and practice? Why?
4. What do they desire to be able to join in this center? price, location, public transportation.
5. Do they know all benefits doing exercises?
After making small survey, you will determine main problem and with finding more information through internet, you can offer appropriate solutions. The more details you prepare, the more successfully you represent. You can ask some friends to receive more ideas.
hongnguyentp92   
Feb 27, 2017
Student Talk / How to train the speaking ability without partner? [27]

Well, you can watch some movies you like with 2 subtitles English and your mother language. After that, you imitate their voices like you are an actress. That's fun. And you can find some useful websites like italki. This website have articles you can read, have communication you can make friends and talk to them. I think the important thing is that you need to keep motivation learning English in long time.
hongnguyentp92   
Jan 11, 2017
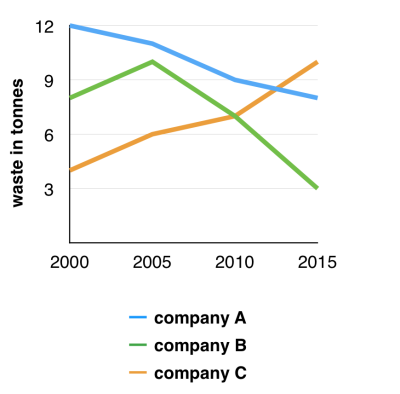
Writing Feedback / The graph below shows the amount of waste produced by three companies over a period of 15 years [8]

Hello everybody. I am new member. I have started writing Ielts and I hope you can help me correct my report. Which band I can get in this task? Thanks a lot.

This is topic in task 1 ( from ielts-simon): The graph below shows the amount of waste produced by three companies over a period of 15 years.

Waste - the side product in an industry


The line graph illustrates the quantity of waste generated from three companies namely A, B, C from 2000 to 2015.
It is clear that both company A and B trended to reduce producing waste, while the amount of waste from company C nearly tripled over the time shown.

In 2000, company A produced the most waste, at 12 tonnes, followed by waste of company B and C with around 8 tonnes and about 6 tonnes respectively. There was a quick increase in the amount of waste of company B and C, at 10 tonnes and 6 tonnes in 2005. In contrast, the figure for company A went down approximately 11 tonnes.

The period from 2005 to 2015 witnessed a sharp rise in the amount of waste produced by company C, and the figure was highest, with nearly 10 tonnes in 2015. Whereas, company A and B reduced producing waste to about 8 tonnes and 3 tonnes respectively.


  • line graph
Writing
Editing Help?
Fill in one of the forms below to get professional help with your assignments:

Graduate Writing / Editing:
GraduateWriter form ◳

Best Essay Service:
CustomPapers form ◳

Excellence in Editing:
Rose Editing ◳

AI-Paper Rewriting:
Robot Rewrite ◳