Writing Feedback /
IELTS Task1. SUA, Sweden and Japan; Proportion of elderly in three different countries. [6]
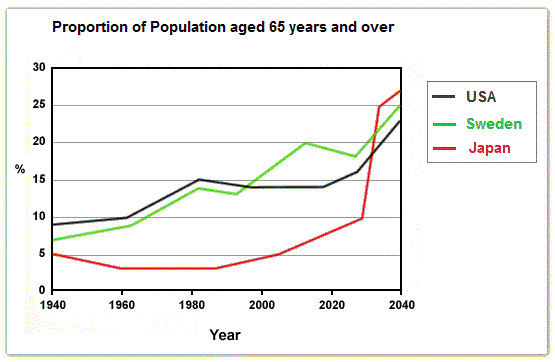
The below graph shows the proportion of the population aged 65 and over between 1940 and 2040 in three different countries, SUA, Sweden and Japan.150 words.
numbers of elderly citizens
The line graph presents the rate of citizens aged 65 and over among three different countries, USA, Sweden and Japan in a period of 100 years length time.
In 1940, the elderly population from SUA and Sweden was at approximately 9% and 7% respectively. Subsequently, the percentage of elderly slightly increased in both West countries until 1980, where followed a slight fall. The rate of elderly national of SUA and Sweden met around 1998 at approximately 14%. However, Sweden 65 aged nationals started to increase sharply reaching 20% in around 2010. Whereas SUA elderly population kept a steady rate. Nevertheless, in 2020 thinks will tale a turn over of the situation for both west countries, as the percentage of elderly ageing 65 and over will rise to approximately 23% for SUA and 25% for Sweden in 2040.
Although, in Japan, the proportion shown in the graph regarding East elderly nationals is a slight fluctuation. In 1940, the rate was at 5% but afterwards slightly decreased until 1960 and 1990 approximately. However, from then kept rising and in 2020 will increase sharply and will surpass the percentages of SUA and Sweden, reaching the peak at 27% in 2040.
All in all, the percentage of elderly population among them three countries, SUA,Sweden and Japan, fluctuate and will increase gradually to 2040.


