kanzanism
Jan 17, 2020
Writing Feedback / IELTS Writing Task I: UK Cinema Attendance of different age citizens, from 1990 to 2010 [5]
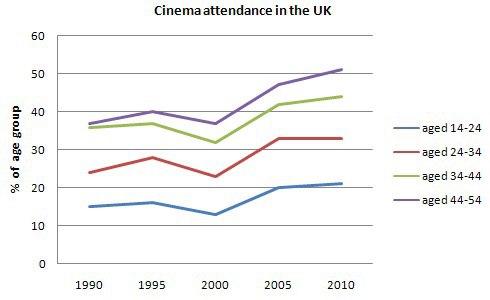
The chart presents the visitors' proportion in the UK cinema by age group from 1990 to 2010.
Overall, visiting the UK cinema was more popular for elderly people rather than other age groups during the whole period, however, the proportion's gap among the four age group had been wider by the end of the period.
Initially, the majority of cinema visitors in the UK was adults aged 44-54 and 34-44, accounting for 36% and 37% subsequently. It was uncommon for youngsters to watch cinema with around 14% of them falling to this category.
Apart from the previous comparison, overall changes saw an upward trend with some fluctuations, and its lowest point stood in the year 2000. Another biggest change was that the gap for overall categories had been wider. Surprisingly, the UK cinema visitors' proportion was as the same as the initial year, even though much higher, where it was dominated by elderly people, leading at 51% people of the group while the gap between this group and people aged 34-44 had been larger, ending at 6% in 2010. The number of the UK cinema's visitor from adolescents and teenagers shared the same trend, falling by 5% and 3% respectively before increasing, and then this prevailed static in the end period with a wider gap compared to the initial period.
cinema visitors' statistics in the uk
The chart presents the visitors' proportion in the UK cinema by age group from 1990 to 2010.
Overall, visiting the UK cinema was more popular for elderly people rather than other age groups during the whole period, however, the proportion's gap among the four age group had been wider by the end of the period.
Initially, the majority of cinema visitors in the UK was adults aged 44-54 and 34-44, accounting for 36% and 37% subsequently. It was uncommon for youngsters to watch cinema with around 14% of them falling to this category.
Apart from the previous comparison, overall changes saw an upward trend with some fluctuations, and its lowest point stood in the year 2000. Another biggest change was that the gap for overall categories had been wider. Surprisingly, the UK cinema visitors' proportion was as the same as the initial year, even though much higher, where it was dominated by elderly people, leading at 51% people of the group while the gap between this group and people aged 34-44 had been larger, ending at 6% in 2010. The number of the UK cinema's visitor from adolescents and teenagers shared the same trend, falling by 5% and 3% respectively before increasing, and then this prevailed static in the end period with a wider gap compared to the initial period.

photo_20200116_16.jpg
