pha
May 17, 2020
Writing Feedback / The chart illustrates changes in the figure for electricity generated by three different sources [3]
IELTS 1
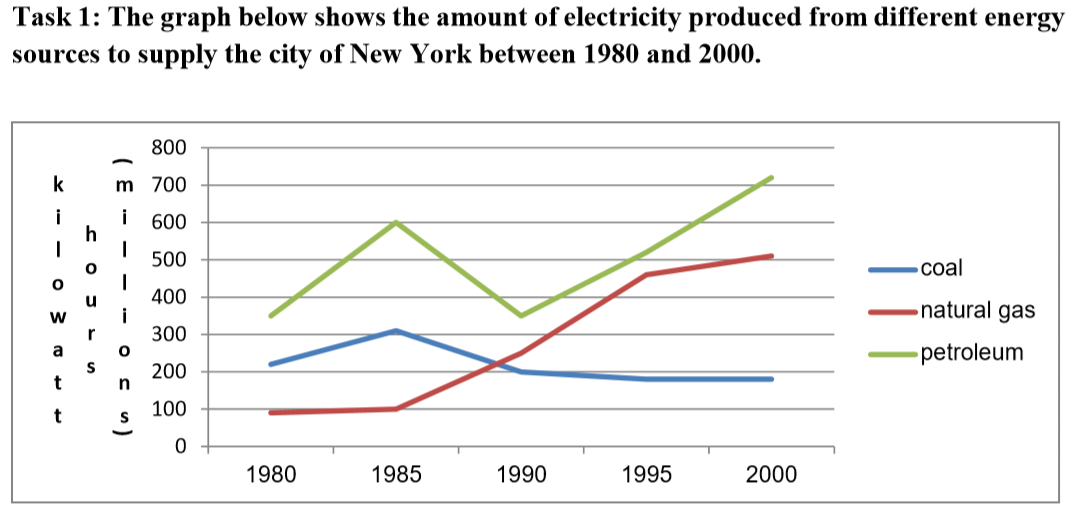
The line chart illustrates changes in the figure for electricity generated by three different sources measured in millions kilowatt hours to supply the city of New York from 1980 to 2000. Overall, petroleum became the main supply energy in the cities, while the figure for natural gas overtook the figure for coal in 1990 and being the second importance sources producing energy over the period of 20 years.
In 1980, petroleum was the most crucial sources generating energy, registered 300 million kilowatt hours. It then decreased erratically, reached a peak of 600 million kw hours in 1985 before falling back to 350 million in 1990. However, the figure for petroleum rose dramatically in the next 10 years, reached a peak of over 700 million kw hours by the end of the period.
On the other hand, coal experienced a gradual rise in 1985, at about 300 million kw hours before decreasing steadily by the end of period, approximately 200 million kw hours. In contrast, the figure for natural gas remained constantly over the first 5 years, it then increased considerably, overtaking coal in 1990 and reaching a peak of over 500 million kw hours in 2000
IELTS 1
the amount of electricity produced from different energy sources
The line chart illustrates changes in the figure for electricity generated by three different sources measured in millions kilowatt hours to supply the city of New York from 1980 to 2000. Overall, petroleum became the main supply energy in the cities, while the figure for natural gas overtook the figure for coal in 1990 and being the second importance sources producing energy over the period of 20 years.
In 1980, petroleum was the most crucial sources generating energy, registered 300 million kilowatt hours. It then decreased erratically, reached a peak of 600 million kw hours in 1985 before falling back to 350 million in 1990. However, the figure for petroleum rose dramatically in the next 10 years, reached a peak of over 700 million kw hours by the end of the period.
On the other hand, coal experienced a gradual rise in 1985, at about 300 million kw hours before decreasing steadily by the end of period, approximately 200 million kw hours. In contrast, the figure for natural gas remained constantly over the first 5 years, it then increased considerably, overtaking coal in 1990 and reaching a peak of over 500 million kw hours in 2000

Untitled2.png

