jhhh11
Jul 1, 2020
Writing Feedback / IELTS TASK 1: Employment Rates of South Korea (line graph) [4]
Hi everyone! I will really appreciate if you can leave some comments on this essay based on the marking criteria of IELTS.
Can anyone please estimate the band score for this essay too? (e.g. should be above 5.5, etc)
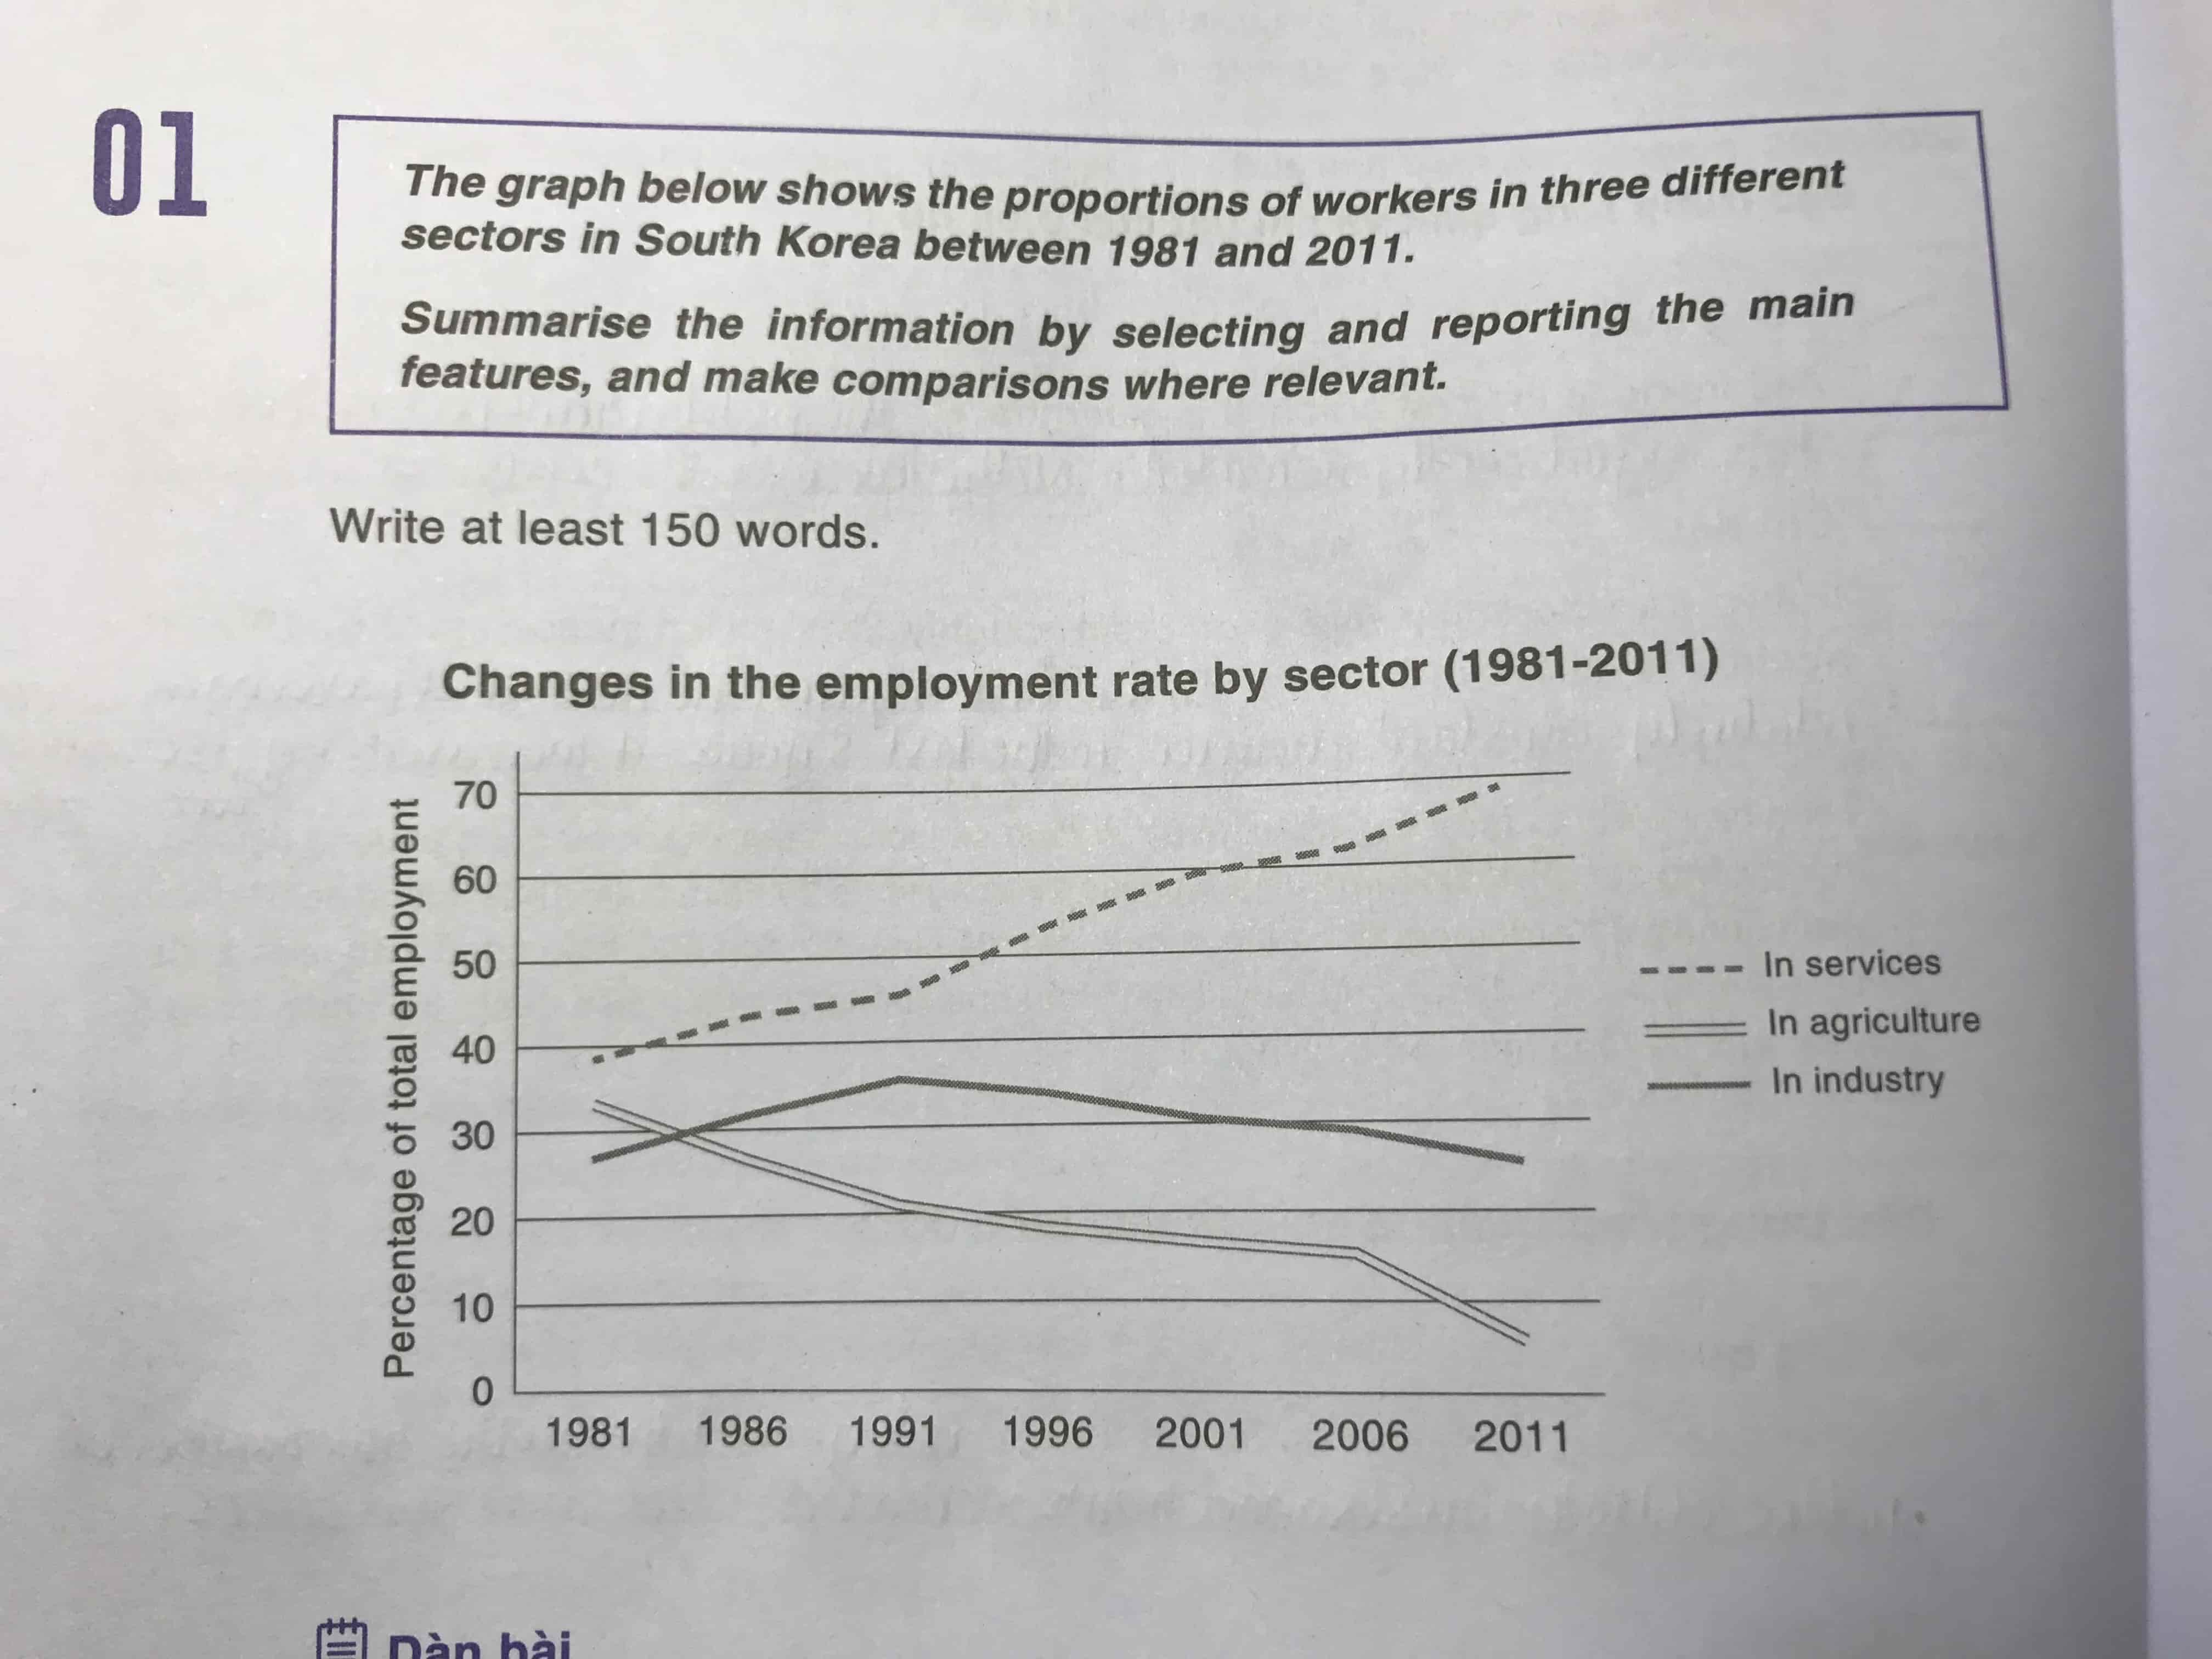
The graph below shows the proportions of workers in three different sectors in South Korea between 1981 and 2011.
Word Count: 190
The line graph above shows the changes in South Korea's figures for 3 sectors of employment between 1981 and 2011. The units are in percentages.
Overall, it is clear that there were great shifts in the employment rates of workers in the service and agriculture sectors, meanwhile, the industrial workforce remains relatively stable. Despite the changes, workers in the service sector always dominated South Korea's total workforce.
Looking at the graph more closely, in 1981, the gaps between the 3 job sectors were minimal. The labor market's shares between service, agriculture, and industry were 39%, 33%, and 28% respectively. Between 1981 and 1991, small upward growths were seen in the service and industry sectors, each increased by 5%, whereas the other declined, down to 20%.
In the next 20 years, service was the only employment sector to gain proportions. It surged dramatically and reached almost 70% of the total workforce in 2011. In contrast, the portion of agricultural workers plummeted rapidly and hit 7% by the end of the period. After 1991, the industry sector went through a downward trend and back near to its original starting point of 26%.
Hi everyone! I will really appreciate if you can leave some comments on this essay based on the marking criteria of IELTS.
Can anyone please estimate the band score for this essay too? (e.g. should be above 5.5, etc)
The graph analysis task
The graph below shows the proportions of workers in three different sectors in South Korea between 1981 and 2011.
Word Count: 190
The line graph above shows the changes in South Korea's figures for 3 sectors of employment between 1981 and 2011. The units are in percentages.
Overall, it is clear that there were great shifts in the employment rates of workers in the service and agriculture sectors, meanwhile, the industrial workforce remains relatively stable. Despite the changes, workers in the service sector always dominated South Korea's total workforce.
Looking at the graph more closely, in 1981, the gaps between the 3 job sectors were minimal. The labor market's shares between service, agriculture, and industry were 39%, 33%, and 28% respectively. Between 1981 and 1991, small upward growths were seen in the service and industry sectors, each increased by 5%, whereas the other declined, down to 20%.
In the next 20 years, service was the only employment sector to gain proportions. It surged dramatically and reached almost 70% of the total workforce in 2011. In contrast, the portion of agricultural workers plummeted rapidly and hit 7% by the end of the period. After 1991, the industry sector went through a downward trend and back near to its original starting point of 26%.