Unanswered [6] | Urgent [0]
  

Posts by heyaaami [Suspended]
Name: Phượng Diễm
Joined: Jun 1, 2021
Last Post: Jun 25, 2021
Threads: 2
Posts: 4  

School: Lk

Displayed posts: 6
sort: Latest first   Oldest first  | 
heyaaami   
Jun 25, 2021
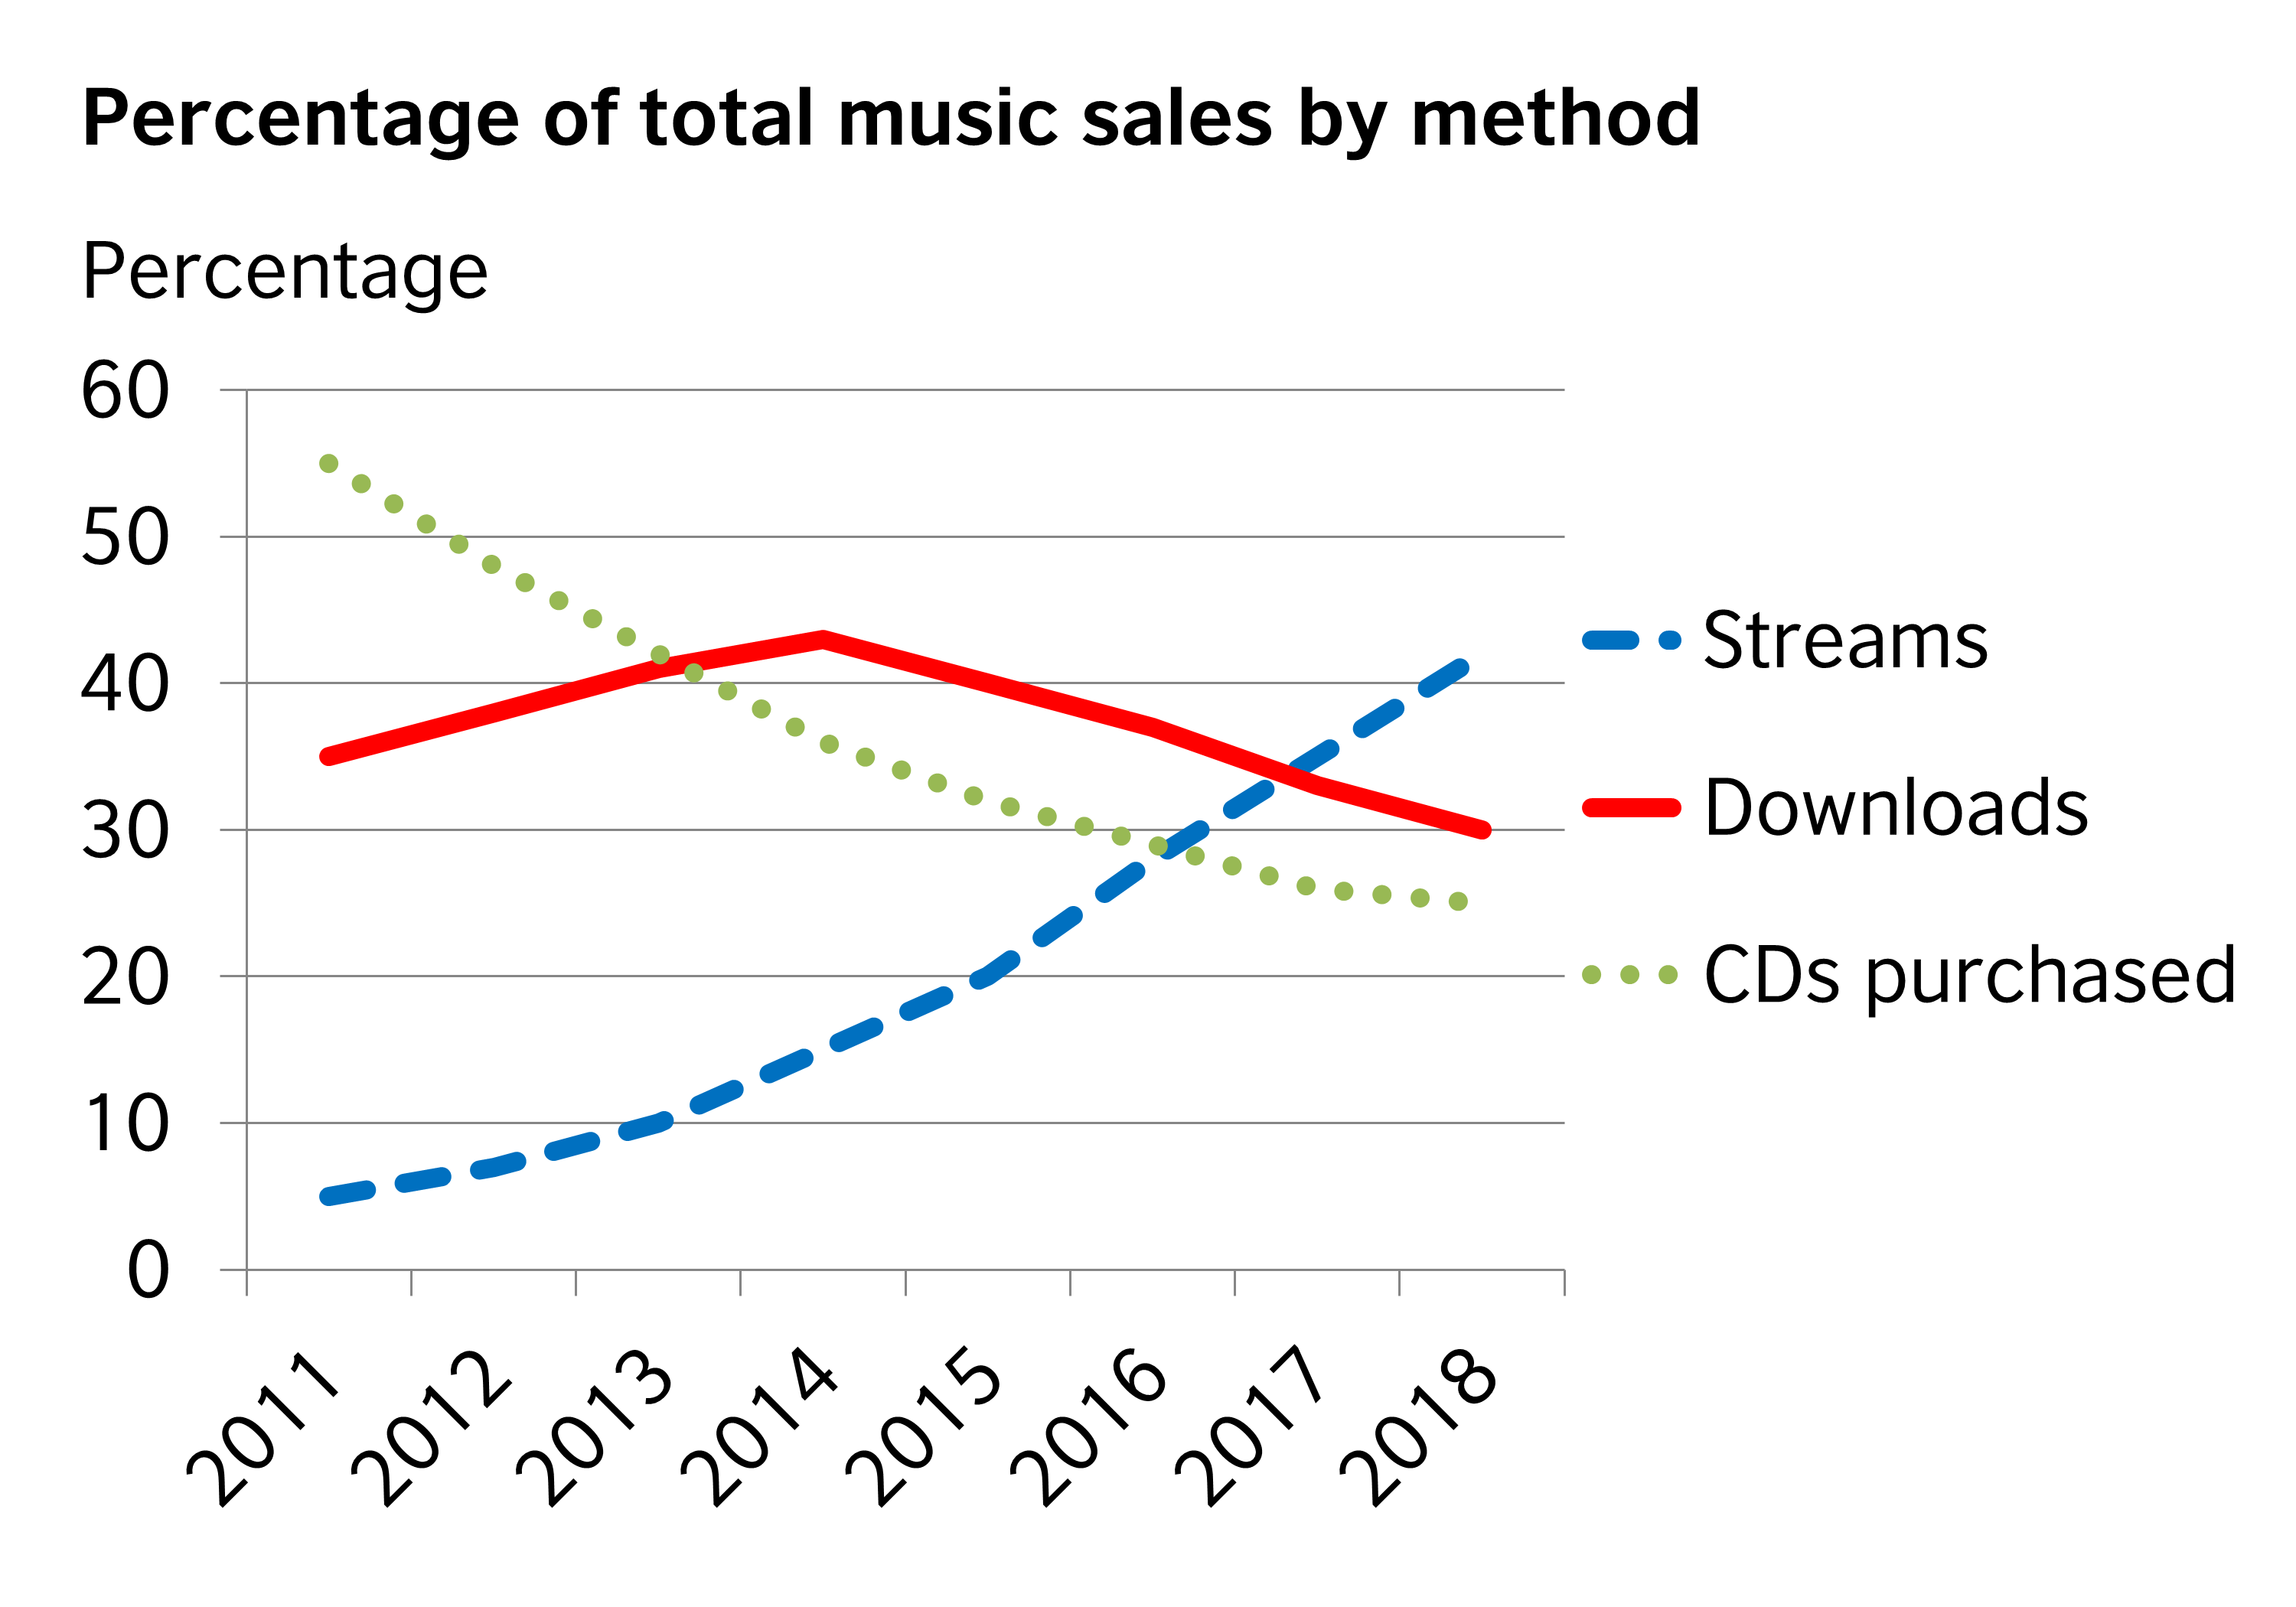
Writing Feedback / Task 1: The graph below shows how people buy music from 2011 to 2018 [NEW]

percentage of total music sales by method


The line graph illustrates the proportion of how much three music methods were purchased from 2011 to 2018.

Overall, there was a considerable increase in people streaming music, which became the most widely used method in the final years, while the percentage of downloading and purchasing CDs were witnessed to decrease slightly throughout the period.

A closer look at the graph reveals that the proportion of streaming stood at nearly 5% in 2011, followed by a gradual rise to over 40% in 2018. In regard to downloading, the figure, which accounted for approximately 34% in the first year of the period, was seen to reach a peak at around 41% in the mid-2014 and then decline significantly to nearly 30% in the final year. The percentage of purchasing CDs, which was the most popular music method in the first year of period, represented at approximately 55% in 2011, 11 times higher than that of streaming. However, the figure slightly went down and ended up at only 36% in 2018.


  • WritingB2Asummary.png
heyaaami   
Jun 1, 2021
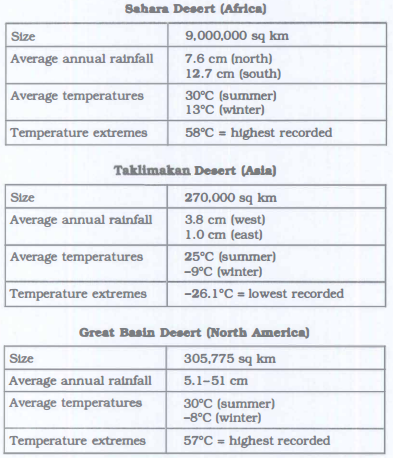
Writing Feedback / The charts below show information about three diffenrents deserts around the world. [2]

Sahara, taklimakan and great basin desert data


These given charts provide information about five remarkable features of three deserts, including size, the amount of rain falling annually, average temperatures and highest or lowest temperatures recorded.

A closer look at the tables reveals that Sahara desert is the most extensive one as it covers up 9 million square kilometres, followed by Taklimakan and Great Basin, which constitute 270000 square kilometres and 305,775 square kilometres respectively. However, Great Basin is considered as a desert that has the biggest distinction between the highest and lowest rainfall in an annual basis recorded as they are 5.1 and 51 cm, following by Sahara and Taklimakan.

Turning to annual average temperatures, vegetation Sahara and Great Basin deserts thrive in the most scorching summer and frigid winter as the temperature can come to 30 Celsius degrees and the one of the winter in Great Basin amounts up to -8 Celsius degree. The heat in Sahara made it the hottest one due to the fact that its temperature extremes is 58 Celsius recorded. In the contrary, Taklimakan makes up -26.1 Celsius degrees in winter, making it the coldest one of three places.

In conclusion, the condition of these environments is too harsh for people to inhabit.


  • inbound2719651202326.png
Need Writing or Editing Help?
Fill out one of these forms:

Graduate Writing / Editing:
GraduateWriter form ◳

Best Essay Service:
CustomPapers form ◳

Excellence in Editing:
Rose Editing ◳

AI-Paper Rewriting:
Robot Rewrite ◳

Academic AI Writer:
Custom AI Writer ◳