Dat Nguyen
Feb 20, 2023
Writing Feedback / IELTS 1: Number of visitors to Louvre, Vatican Museums, London Science Museum, and Shenzhen Museum [3]
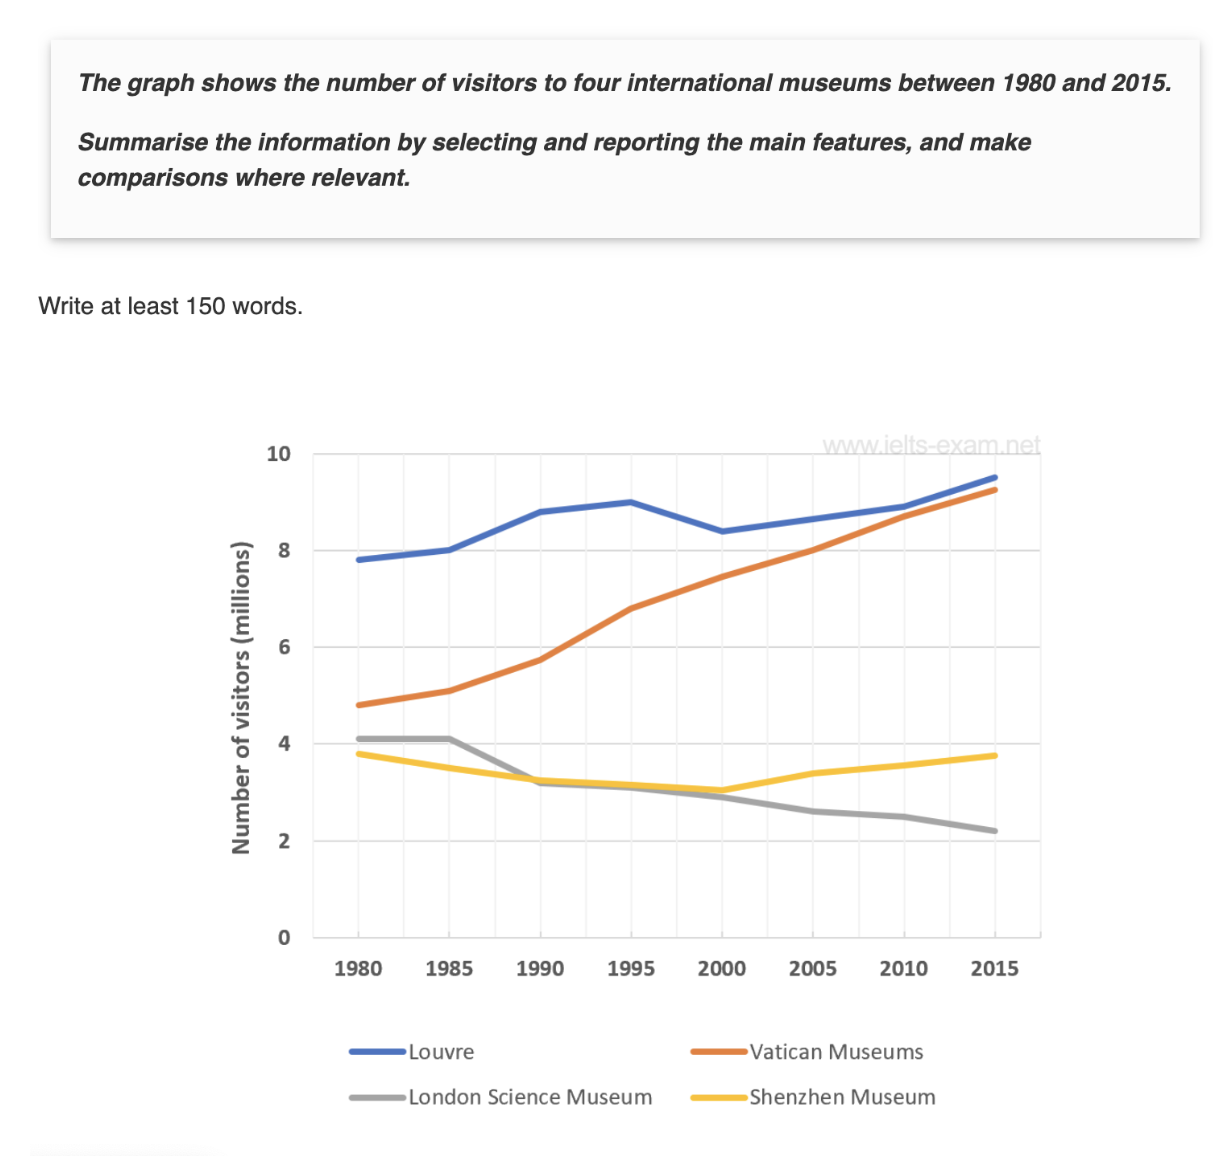
The line graph illustrates how many people visited four different international museums, namely, Louvre, Vatican Museums, London Science Museum, and Shenzhen Museum, over a period of 35 years, starting from 1980
Overall, it can be seen that the number of visitors to the Louvre and Vatican Museums saw an upward trend in the period time shown. On the other hand, the figures for London Science Museum experienced a gradual fall and the number of people who visited the Shenzhen Museum remained the same.
Looking at the details, Louvre received about 9 million visitors in 1995, which increased by nearly 1.2 million compared to 7.8 million in 1980. It then had a slight decline in 2000 before it reached a peak of nearly 9.5 million visitors in 2015. A similar trend was seen in Vatican Museums. It grew significantly from nearly 5 million to 9 million between 1980 and 2015.
In contrast, the number of visitors to London Science Museum remained unchanged in the first five years at 4 million, then dropped dramatically to 2.2 million in 2015. Moreover, Shenzhen Museum fluctuated between 3 million and 3.8 million visitors from 1980 to 2015.
Number of visitor to four international museums between 1980 and 2015
The line graph illustrates how many people visited four different international museums, namely, Louvre, Vatican Museums, London Science Museum, and Shenzhen Museum, over a period of 35 years, starting from 1980
Overall, it can be seen that the number of visitors to the Louvre and Vatican Museums saw an upward trend in the period time shown. On the other hand, the figures for London Science Museum experienced a gradual fall and the number of people who visited the Shenzhen Museum remained the same.
Looking at the details, Louvre received about 9 million visitors in 1995, which increased by nearly 1.2 million compared to 7.8 million in 1980. It then had a slight decline in 2000 before it reached a peak of nearly 9.5 million visitors in 2015. A similar trend was seen in Vatican Museums. It grew significantly from nearly 5 million to 9 million between 1980 and 2015.
In contrast, the number of visitors to London Science Museum remained unchanged in the first five years at 4 million, then dropped dramatically to 2.2 million in 2015. Moreover, Shenzhen Museum fluctuated between 3 million and 3.8 million visitors from 1980 to 2015.

ScreenShot202302.png

