Cuynomellen
Feb 11, 2015
Writing Feedback / Coffee export in three different countries in South America - IELTS task 1 [2]
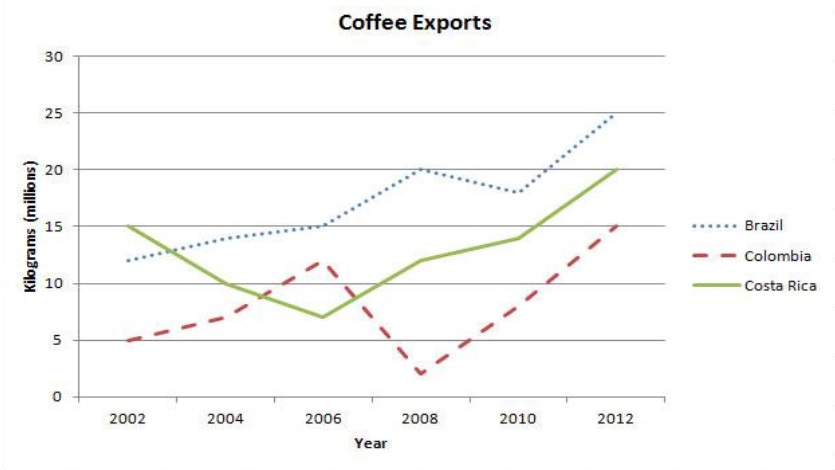
The line graph below in the amount of coffee exported from three countries between 2002 and 2012.
The line graph provides a breakdown of information in terms of the amount of export in coffee from three different South American countries between 2002 to 2012 over a-10 year period. This figure is measured in millions of kilograms.
Overall, what stands out from the graph examines that coffee exports experienced an upward and downward trend. On the other hand, coffee exports in three different countries tended to reveal a dramatic rise throughout the period.
A more detailed look at the graph reveals that Coffee export from Brazil and Colombia recorded a significant rise in the reminder of the time. The number of coffee exports in Brazil inclined dramatically from 2002 to 2012 between 10 to 25, a rise of around 15 kilogram. Standing in contrast, the total of coffee exports from Colombia leveled out in the same period.
The striking point is that the figure in 2006 of Colombia was a dramatic decline at just under 10 million. By comparison, approximately 15 million was a slight increase in Brazil. Another interesting change, in 2010 the figure for Brazil was a moderate decline, representing roughly 18 kilograms, whilst the number of coffee exports saw a slight climb, with figure accounted for 15 kilograms. In the end of period, the figure for Brazil was higher than Colombia, regarding the amount of coffee exports accounted for about 25 kilograms. However, the figure of Colombia recorded the second list of coffee export, about 20 kilograms.
By far coffee export in Costa Rica stood at 5 kilogram,which was the lowest of other two countries. In sharp contrast to this, it pointed out a significant grow in 2006, at just over 10 kilograms. After the next years, it plummeted to 2 kilogram in 2008. Conversely, the data saw a significant climb from 2010 to 2012 between 10 and 15, an increase of 5 kilograms.

task1.jpg