LFAle
Dec 3, 2014
Writing Feedback / IETLS W1 poverty rates by age and gender (bar chart) and family composition of women in poverty... [3]
Hello! These are the graphs belove my answer
"You should spend about 20 minutes on this task.
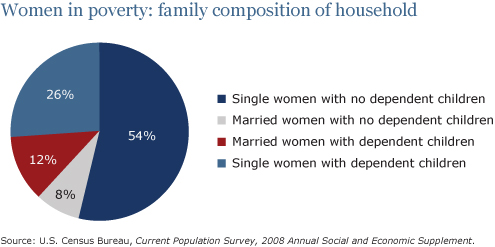
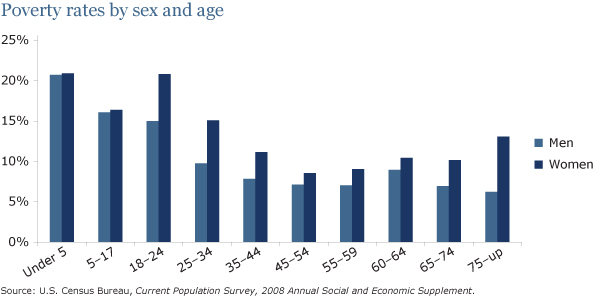
The pie chart shows the percentage of women in poverty and the bar chart shows poverty rates by sex and age. They are from the United States in 2008.
Summarize the information by selecting and reporting the main features and make comparisons where relevant.
Write at least 150 words."
--
The charts illustrate poverty rates by age and gender (bar chart) and family composition of women in poverty (pie chart). They refer to United States in 2008.
It is clear that women were significantly poorer than men, and the former were nearly all single women. In detail, being single was the key feature with a total of 80% made up of single women with no dependent children (54%) and ones with dependent children (26%). In addition, the third main poverty percentage regards married women with dependent children (12%).
Furthermore, we can see how women poverty rate were a continuum of decrease throughout the first period of life; around 20% of poverty rate under 5 years old, to approximately 8% at 44-54, despite a peak at 18-24 where poverty rate went back to 20%. Thereafter, according to the bar chart, the rates increased gradually in late adulthood.
Finally men, who had a similar initial poverty rate (around 20%), ended up having a significant fall in poverty rate with age (approximately 5% at 75-up compared with around 15% for women).

ieltspiechartwome.jpg
2.jpg
