yogi07
Jan 18, 2016
Writing Feedback / The proportion of the most favourite tourist choices in Brighton attentions over 3 decades 1980-2010 [3]
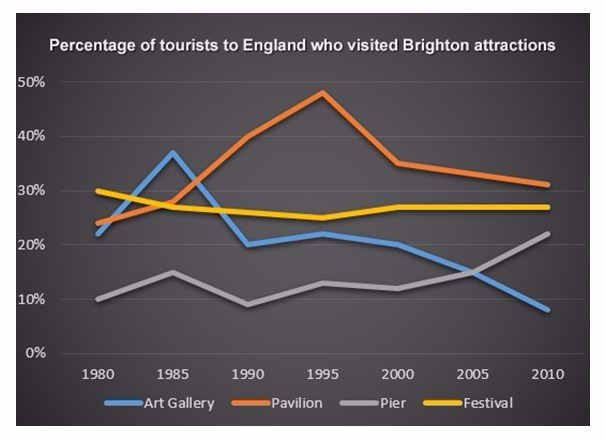
The graph illustrates the proportion of the most favourite tourist choices in Brighton attentions over 3 decades from 1980 to 2010. Overall, it is important to note that, despite some fluctuations, the top rank changed from Festival to be Gallery in 1985 that fell sharply after reaching the highest number, but then the Pavilion overtook in the next following years.
There was a dramatic rise in the level of tourists in Art Gallery and Pavilion. They began at a fairly similar level of at 20% to 25% in 1980 but while Art gallery tourists were a significant fall in 1985 after reaching a peak of approximately 40 per cent which was followed by a sudden jump and then gradually decrease. However, Pavilion overtook art gallery in 1990, as the most favourite destination and almost a half of total tourist visited in 1995. Following this, the number decreased gradually to finish the period at 35%.
Pier and festival had different pattern. Pier fluctuated during 2 decades, which hit a lowest of 10%, though there was a sharp increase for the last period. Then, the festival proportion virtually growth for 30 years between 27% and 30%

AvjbsYEI4t0tJpcLJAz7.jpg


