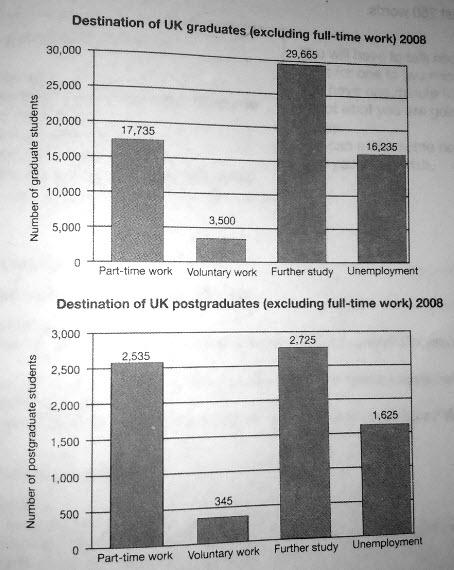
Prompt:The charts below show what the UK graduate and postgraduate students who did not go into full-time work did after leaving college in 2008. Summarize the information by selecting and reporting the main features, and make comparisons where relevant.
The bar charts provide data on what the students (graduate and postgraduate) of the UK, who did not get into full time work did upon graduation in 2008.
Overall, the number of graduate students fell into all four categories (part-time work, voluntary work, preferred to study further, and unemployed) were significantly greater, in contrast to postgraduate students.
The number of graduate students who preferred to study further were ten times higher (around 30,000) than the number of postgraduate students (around 3,000) who preferred to do the same after graduating. Likewise, highest number of students (above 15,000) who ended up doing part-time jobs upon graduation were also graduate students. The number of post graduate students who did part-time jobs was around 2500.
In terms of unemployment, over 16,000 graduate students were unemployed, whereas only one tenth of postgraduate students (around 1600) were unemployed after graduation. Interestingly, volunteering work, on the other hand, was the least preferred stream of work by both the graduate and the postgraduate students.
----------------------------------------------------------------------------------------------------------------------------------------------------------------------------------------------
Number of words = 166.
I have a few questions regarding this task. I'm highly skeptical of my performance as I took more than 30 minutes to come up with an answer, since I found the chart to be too simple to describe. I kept rewriting the answer in order to meet the task requirements.
1. Is it just me or is it true that the chart is too simple?
2. I've read from various websites that one must not include their opinion while writing task 1, how true is that?
3. Is there another way to answer this task? If so, could you please tell me how?
----------------------------------------------------------------------------------------------------------------------------------------------------------------------------------------------

260789_1_o.jpg
