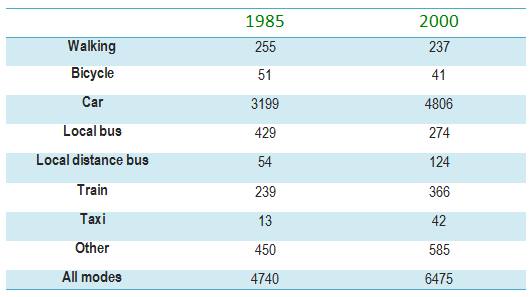
The table below gives information about changes in modes of travel in England between 1985 and 2000.
A breakdown of altering of average distance each person per year in miles in types of travel in England from 1985 to 2000 is revealed in the table. Overall, it can be seen that in general, the distance of all modes of accommodation increased highly in 2000 and just three types (bicycle, walking and local bus) declined over 15-years period.
To begin with, there were six types of travel that the distance solely rose in 2000. Firstly, taxi and other modes of travel had the same number of distance which increased at around 130 miles in 2000. Manual distance of "local distance bus" mode in 2000 was approximately two times higher than in 1985 at 124 miles. Besides, the greatest improvement was car, when in 1985 it was at 3,199 miles and in 2000 it recorded at 4,806 miles.
On the other hand, there were three types of travel that dropped slightly in 2000. Firstly, the distance of walking and local bus was close behind at higher than 200 miles at 1985. After that, the distance of walking was a step decline of 15 miles and local bus fell extremely by 150 in 2000. Similarly, the distance of bicycle was 10 miles smaller in 2000 than in 1985.

Question
