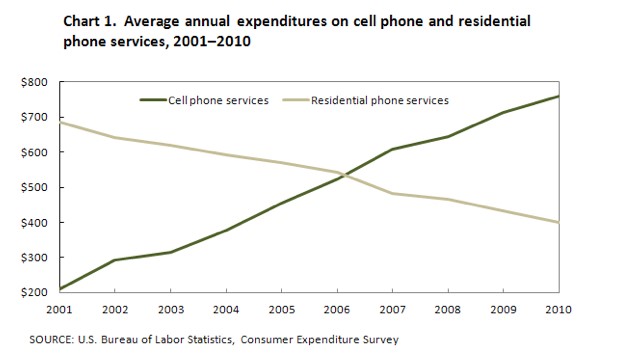
US consumers' average annual expenditures on cell phone
The graph illustrates American consumers' average yearly expenses on moblie phone and landline phone services from 2001 to 2010. The main feature of the graph is two opposite trends in the amount of money allocated for these two types of service with the significant growth in the spending on cell phone services and the decline in that of residential phone services for a period of 10 years.
Starting at $200 in 2001, the expenditures on mobile phone services are less than that on landline phone services by approximately $500. One year later, this situation changed with a sudden increase to $300 in the former while the latter had a tendency to drop at under $700. These two opposite trends occurred continuously for 4 years until they were in the same position ($550) in 2006. Then the money paid out for cell phone services continued to go up at over $600 whereas the other fall at under $500 in 2007. For the next 3 years, the situation was obviously similar to the situation in the period from 2003 to 2006. By 2010, the expenses on cell phone services are nearly twice as much as that on landline phone services.
* *𝑃𝑙𝑒𝑎𝑠𝑒 𝑚𝑎𝑘𝑒 𝑠𝑜𝑚𝑒 𝑐𝑜𝑚𝑚𝑒𝑛𝑡𝑠 𝑜𝑛 𝑚𝑦 𝑝𝑜𝑠𝑡 𝑎𝑛𝑑 𝑔𝑖𝑣𝑒 𝑚𝑒 𝑎𝑙𝑙 𝑦𝑜𝑢𝑟 𝑎𝑑𝑣𝑖𝑐𝑒, 𝑡ℎ𝑎𝑛𝑘 𝑦𝑜𝑢 𝑣𝑒𝑟𝑦 𝑚𝑢𝑐ℎ 𝑖𝑛𝑑𝑒𝑒𝑑!

E5579831385C46D59.jpeg
