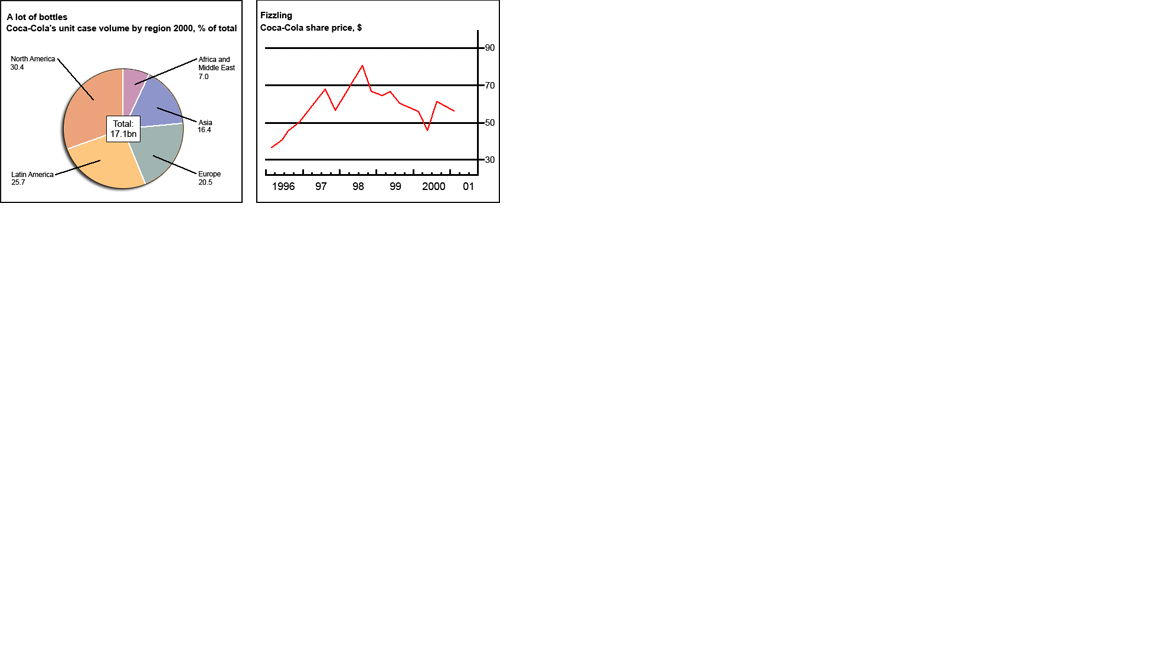
The pie chart shows the percentage of coca-cola's global scale in 2000,while the line graph illustrates the changes in its share prices between 1996 and 2001.
It is clear that American continent accounted for the largest proportion of coco-cola sales in 2000 and that overall,the share price for it increased considerably over the given period.
In 2000,around 30% of total coca-cola sale was in North America,along with more than a quarter in Latin America and together they comprised over half of the the total sales.Europe contributed more than 20% to the total sales ,whereas the sales in Africa and Middle East was significantly lower ,at 7 %.The figure for Asia was relatively better than that ,at 16.4%.
In 1996,the share price for coca-cola stood about 35$,which doubled in the next year.It is interesting to note that the coca-cola share price peaked in 1998,with around 80$,though it slumped below 50$ in 2000.By 2001,the price again rose to above 60$.
170 WORDS.
PLASE FEEL FREE TO GIVE COMMENTS AND SUGGESTION .I WROTE THIS ONE IN 20 MINUTES.

FIGURE 1 & 2
