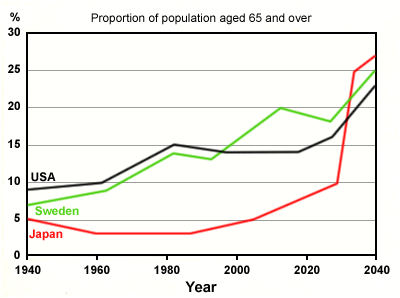
A breakdown of the percentage of elderly people in three selected countries (the USA, Sweden, and Japan) in the a century period started in 1940 is given in the line chart and measured in percentage. Overall, it is really crucial to notice that three countries have similar pattern and expected increase with similar pattern in the future. Also, although Japan has been the lowest for decades, the percentage of elderly people will be the highest in the last decade.
From 1940 to 1980, both the percentage American and Sweden in the age group of 65s went up significantly at 15 and 14 percent respectively, whereas a plenty of Japanese in the same age group saw a slight decrease below 5 percent. In 2000s, there is predicted that the proportion of aging people in Sweden has overtaken the highest one up to 20 percent.
Turning to the next decades, Sweden and the USA proportion will experience a dramatic rise, while the percentage of Japanese population will go up sharply by 15 percent and overtake the highest figure at over 25 percent.
(180 words)

elderly people
