Unanswered [1] | Urgent [0]
  

Home / Writing Feedback   % width   Posts: 3


Americans spending on diffrend kinds of phone services from in a ten-year period


hasbi 29 / 41  
Nov 23, 2015   #1
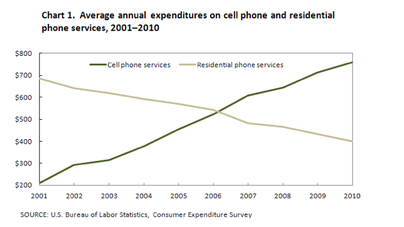
A comparison of the annual amount of Americans spending on mobile and mobile phone services from 2001 to 2010, a ten-year period is illustrated in the line chart. Overall, it can be seen that people were more likely to spend money on residential phone services rather than on mobile phone services at the beginning. However, these figures showed a reverse in the last period.

In 2001, the highest expenditure was US consumers, which spent an average of virtually $700 on residential phone services, compared to cell phone services, at solely $200. Over the following five years, this figure has plummeted by $200. Contrastingly, expenditure on mobile services has increased by around $300.

In 2006, the average American's spending on both figures was equal, at nearly $500. On the other hand, by 2010, expenditure on mobile phones exceeded the number of residential services and reached a peak to $700, while spending on residential services had fallen to just $400 over the time frame.

  • bg.png


vangiespen - / 4077  
Nov 23, 2015   #2
Hi Hasbi, this is not a bad effort. You presented the discussion in a clear manner and show a high ability to understand the charts and then translate it to words. Your grammar just needs to be corrected in order to deliver a smoother report. Please refer to my advised changes below:

A comparison of the annual amount of Americans spending on mobile and mobile phone services COVERING A 10 YEAR PERIOD from 2001 to 2010, a ten-year period is illustrated in the line chart. Overall, it can be seen that people were more likely to spend SPENT MORE money on residential phone services rather than on mobile phone services at the beginning. However, t These figures showed a reverse in the last period.

In 2001, the highest expenditure EXPENSES WERE INCURRED BY THE was US consumers, which WHO spent an average of virtually $700 on residential phone services, compared to cell phone services, at solely ONLY $200. Over the following five years, this figure has plummeted by $200. Contrastingly, expenditure IN CONTRAST EXPENSES on mobile services has increased by around $300.

In 2006, the average American's spending on both figures was equal, at nearly $500. On the other hand, by 2010, expenditure on mobile phones exceeded the number of residential services and reached a peak to OF $700, while spending on residential services had fallen to just $400 over the SAME time frame.
eddies [Contributor] 25 / 1170  
Nov 23, 2015   #3
- A comparison of HOW AMERICANS SPEND THEIR MONEY on mobile and mobile phone services from 2001 to 2010, a ten-year period is illustrated in the line chart.

- In 2001, BY FAR the highest MONEY SPENT was NOTED BY US consumers, SPENDING an average of virtually $700 on residential phone services, compared to cell phone services, at solely $200. Over the following five years, this figure plummeted to $200. THIS IS IN STARK CONTRAST TO expenditure on mobile services INCREASING by around $300.


Home / Writing Feedback / Americans spending on diffrend kinds of phone services from in a ten-year period
Do You Need
Academic Writing
or Editing Help?
Fill out one of these forms:

Graduate Writing / Editing:
GraduateWriter form ◳

Best Essay Service:
CustomPapers form ◳

Excellence in Editing:
Rose Editing ◳

AI-Paper Rewriting:
Robot Rewrite ◳

Academic AI Writer:
Custom AI Writer ◳