Hello everyone, I hope you can provide me with your feedback.
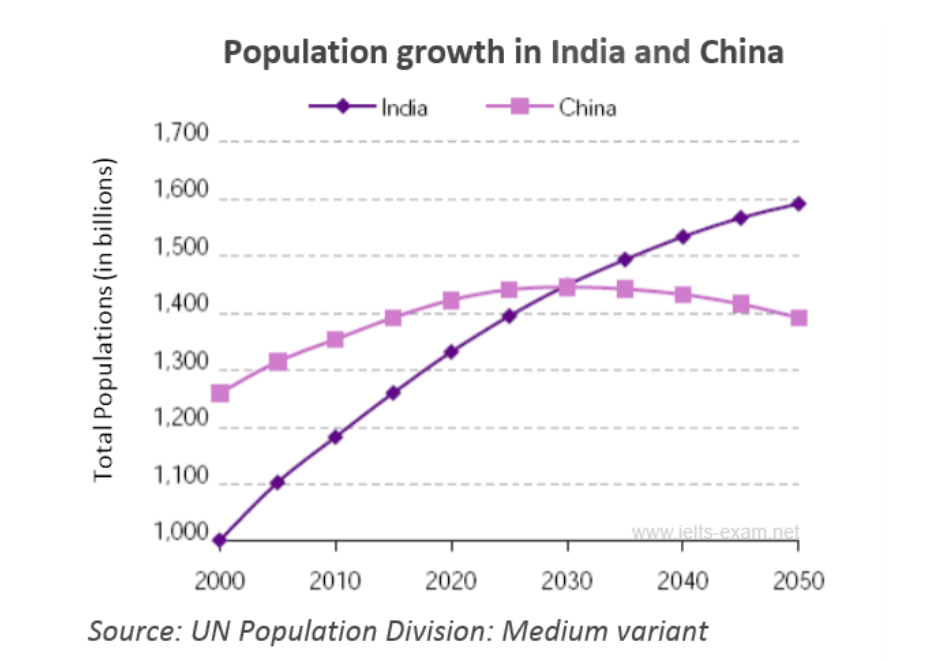
The line graph illustrates the amount of China and India's population from 2000 until now and the predicted number up to 2050. Overall, it is very clear that the population in both countries has been rising and will continue growing except Chinese population which will fall afterwards.
At the beginning of the period, the number of Chinese people in China was more than India's population by being 1.200 and 1.000 billion respectively. The figures has been growing up to the moment by having almost 1.500 billion for china and nearly 1.350 billion for India.
In the future, the graph expects that population will continue growing in both countries and it will become about 1.420 by 2030. After 2030, the number of people in China starts declining and it becomes almost 1.400 in 2050. But when it comes to India, the population will continue to grow even after 2030 which exceeds China in that respect. It is expected that India's population will reach almost 1.600 billion in 2050
Note: 163 words
IELTS TASK 1 Population in India and China since the year 2000
The line graph illustrates the amount of China and India's population from 2000 until now and the predicted number up to 2050. Overall, it is very clear that the population in both countries has been rising and will continue growing except Chinese population which will fall afterwards.
At the beginning of the period, the number of Chinese people in China was more than India's population by being 1.200 and 1.000 billion respectively. The figures has been growing up to the moment by having almost 1.500 billion for china and nearly 1.350 billion for India.
In the future, the graph expects that population will continue growing in both countries and it will become about 1.420 by 2030. After 2030, the number of people in China starts declining and it becomes almost 1.400 in 2050. But when it comes to India, the population will continue to grow even after 2030 which exceeds China in that respect. It is expected that India's population will reach almost 1.600 billion in 2050
Note: 163 words

ttt.PNG
