Hi Mrs Holt! Would you please give feedback for my writing? Thank you!
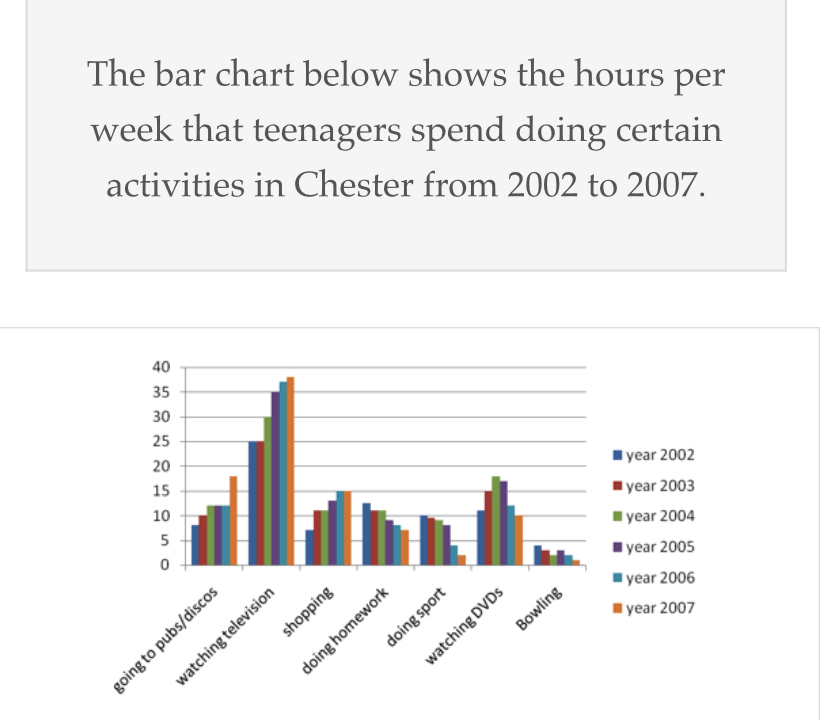
The bar chart illustrates the amount of hours the teenagers in Chester spend in a week for doing activities between 2002 and 2007.
Overall, the most popular activity among the teenagers was watching the TV. On the other hand, bowling accounted for the lowest amount of hours the teenagers spent. Furthermore, as shown on the figure, other activities were spent at the average.
In 2007, teenagers spent time going to pubs for over 15 hours as the highest. Among all activities, bowling was the least amount of hours spent which only reached slightly above 0 in 2007. Meanwhile, the amount of hours spent on shopping climbed steadily every year and reach its highest at 15 hours in 2007.
In terms of homework, the amount of hours spent dropped every year to its lowest of just over 5 hours in 2007. Similarly, as years went by the teenagers spent less amount hours on sports and the lowest amount was above 0 in 2007. The amount of hours teenagers watching DVDs increased to its peak at below 20 after which decreased to its lowest at 10 hours.
IELTS WRITING TASK 1 - HOURS SPENT IN CHESTER
The bar chart illustrates the amount of hours the teenagers in Chester spend in a week for doing activities between 2002 and 2007.
Overall, the most popular activity among the teenagers was watching the TV. On the other hand, bowling accounted for the lowest amount of hours the teenagers spent. Furthermore, as shown on the figure, other activities were spent at the average.
In 2007, teenagers spent time going to pubs for over 15 hours as the highest. Among all activities, bowling was the least amount of hours spent which only reached slightly above 0 in 2007. Meanwhile, the amount of hours spent on shopping climbed steadily every year and reach its highest at 15 hours in 2007.
In terms of homework, the amount of hours spent dropped every year to its lowest of just over 5 hours in 2007. Similarly, as years went by the teenagers spent less amount hours on sports and the lowest amount was above 0 in 2007. The amount of hours teenagers watching DVDs increased to its peak at below 20 after which decreased to its lowest at 10 hours.

CC8C7210313D46C18.jpeg
