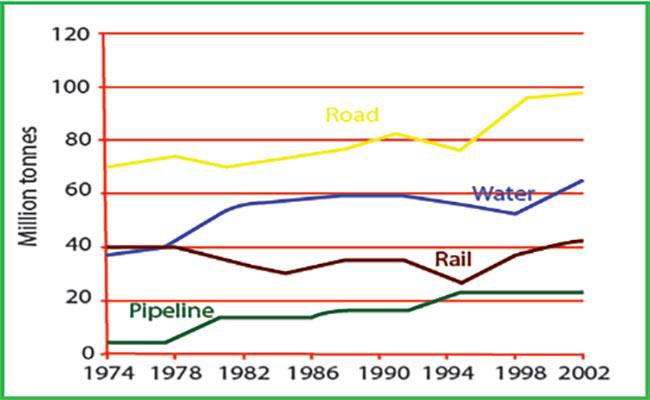
The graph above shows the quantities of goods transported in the UK between 1974 and 2002 by four different modes of transport.
Summarize the information by selecting and reporting the main features, and make comparisons where relevant
The line chart gives information about the amount of merchandise in million tones that has been carried in UK by four modes of transport since 1974 to 2002. Overall, it can be seen that, there was upward trend by 4 modes transportation, whereas Road was the highest transport to goods transported in the same period while, Pipeline was the smallest transportation that used to carry of goods.
In 1974, at least 40 million tones of goods transported by Rail and water, Pipeline just under 20 million tones, and the highest was road at 70 million tones. Pipelines and water grow up in 1982, while the Road and The Rail were fall down. However, there was drop and increase of merchandise, between 1982 and 1994 fluctuated in the quality of goods transported by 4 modes transportation. Whereas, pipeline as much as 21 million tones, pail decreased at least 22 million tones, water under 60 million tones and Road fluctuated at 78 million tones.
During 1994-2002 there was upward trend by four transportation and based on the figure, the amount of road which was used was the bigger than others as much as 90 million tones. Others under of 50 million tones and the smallest was Pipeline in the number of goods transported.

290109_1_o.png
