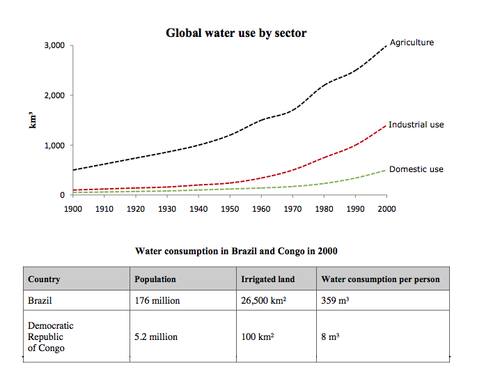
The graph and table below give information about water use worldwide and water consumption in two different countries.
The line graph compares the amount of water used in three sectors, while the table illustrates the plenty of water consumption on both Brazil and Congo in 2000. Overall, it is immediately apparent that a great amount of water distributed to agricultural sector. Moreover, the amount of water consumption also influenced by the huge number of population, instead Brazil.
First and foremost, water would be used for three of farmland, industrial and domestic sector. Interrestingly, from 1900 to 2000, agriculture noticed as the most sector with the largest water using among the other and this amount of water become large and large till the end of period , which was 3,000 km3. In addition, the other sectors, either domestic or industrial have the same amount of water using from 1900 to 1950. Water using on both sectors also exhibit a gradual jump trend, but industrial sector reckons the higher than domestic water using in the end of timeline.
On the other hand, Water consumption in Brazil and Congo were very different. In can be seen clearly that each person in Brazil need about 359 m3 water, while Congo's population just using 8 m3. It is linear with the number of their population, Brazil population is higher than Congo. Moreover, on irrigated land consumption also showed a significant gap while Brazil can watering 26,500 Km2 and Congo just 100 Km2.
measured numbers of water consumption
The line graph compares the amount of water used in three sectors, while the table illustrates the plenty of water consumption on both Brazil and Congo in 2000. Overall, it is immediately apparent that a great amount of water distributed to agricultural sector. Moreover, the amount of water consumption also influenced by the huge number of population, instead Brazil.
First and foremost, water would be used for three of farmland, industrial and domestic sector. Interrestingly, from 1900 to 2000, agriculture noticed as the most sector with the largest water using among the other and this amount of water become large and large till the end of period , which was 3,000 km3. In addition, the other sectors, either domestic or industrial have the same amount of water using from 1900 to 1950. Water using on both sectors also exhibit a gradual jump trend, but industrial sector reckons the higher than domestic water using in the end of timeline.
On the other hand, Water consumption in Brazil and Congo were very different. In can be seen clearly that each person in Brazil need about 359 m3 water, while Congo's population just using 8 m3. It is linear with the number of their population, Brazil population is higher than Congo. Moreover, on irrigated land consumption also showed a significant gap while Brazil can watering 26,500 Km2 and Congo just 100 Km2.

17760226_14649807668.jpg
