Writing task 1 : Food Consumption in China
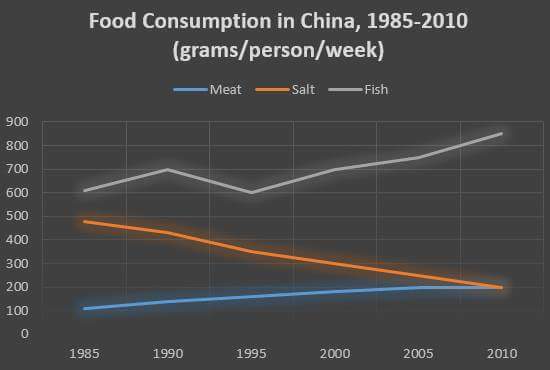
The line chart compares the amounts of meat, salt, and fish consumed in China, starting from 1985 to 2010. It can be clearly seen that the fish consumption numbers were much higher than other foods.
The fish became the most popular food in China as long as 25 years. The figure of fish consumption always grew even bigger in every year, with rare exception between 1990 and 1995 where the consumption rate drastically pulnged until 100 grams per person in each week. Thereafter the number of meat consumption rapidly increased to 900 grams in 2010.
In 1985, The consumption of salt reached about 490 grams. Afterwards the number of salt consumption always gradually declined and reached the lowest figure in 2010 (200 grams) . On the other hand, the meat consumption had the lowest figure in 1985 (100 gram). Nevertheless, people consuming the meat constantly went up time by time and recorded the biggest number of meat consumption in 2010 where it achieved 200 grams.

the line chart
