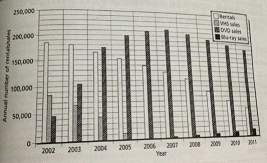
The chart below shows the annual number of rentals and sales (in various formats) of films from a particular store between 2002 and 2011.
Summarise the information by selecting and reporting the main features, and make comparisons where relevant.
The bar chart illustrates information regarding the amount of rentals and sales in different types of movies from a particular store from 2002 to 2011. At first glance, it is evident that the annual number of rentals decreases significantly over the period, and this trend was followed by VHS sales, even just the first four years. Noted, the annual number of DVD sales saw a dramatic increase until the middle of period and it was a dramatic decrease at the end of period.
According to the bar chart, it shows that the annual number between rentals and VHS sales have the similar pattern, both figures experienced a slight decrease of the period in question. The annual number of rentals stood at around 180,000 in 2002 and it was a slight decrease at 60,000 in 2011. And the amount of VHS sales dropped from 80,000 to 10,000 in 2005.
Moving to a more detailed analysis from the bar chart, it reveals that DVS sales type increase gradually at the first six years, and it was reached a peak at approximately 300,00 in 2007. While this figure saw a significant decrease over the next period. Finally, the annual number of blue-ray sales only resulted at around 10,000 in the end of period.

Capture.PNG
