My target score is 6.5 and if you could give a feedback of my writing, I would really appreciate it! Thanks!
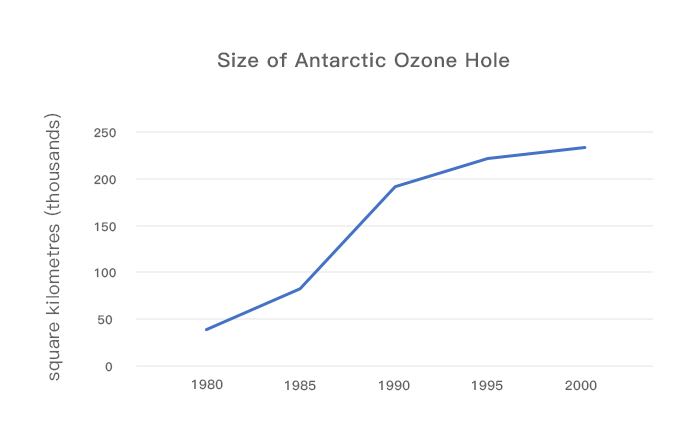
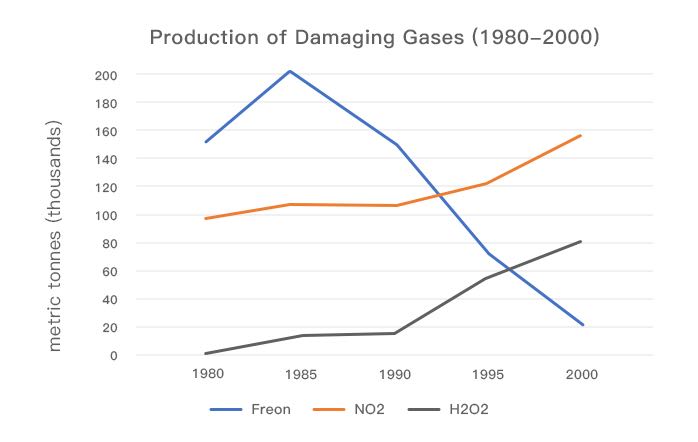
The line graphs give information about different types of damaging gases which change the size of Antarctic ozone hole from 1980 to 2000.
During the past two decades, the size of ozone hole in Antarctic area kept growing steadily and reached at 240,000 square kilometers in 2000. Comparing with other two gases, the production of freon has undergone the largest degree of fluctuation, while that of NO2 and H2O2 has generally increased.
The year 1985 witnessed a big change taking place in freon. To illustrate, the production of freon has been rising rapidly since 1980, peaking at 200,000 metric tonnes in 1985. Since then, however, its production began to fall to a great extent, reaching the bottom of 40,000 metric tonnes.
In contrast, the production of NO2 and H2O2 was markedly growing from 1990 to 2000, reaching 158,000 metric tonnes and 80,000 metric tonnes respectively, while both of them stabilized between 1985 and 1990.
To sum up, the production of NO2 and H2O2, which contributed to the damage of Anatarctic ozone hole, will continue growing, and that of freon seems to keep decreasing in the future.
Antarctic ozone hole and damaging gases
The line graphs give information about different types of damaging gases which change the size of Antarctic ozone hole from 1980 to 2000.
During the past two decades, the size of ozone hole in Antarctic area kept growing steadily and reached at 240,000 square kilometers in 2000. Comparing with other two gases, the production of freon has undergone the largest degree of fluctuation, while that of NO2 and H2O2 has generally increased.
The year 1985 witnessed a big change taking place in freon. To illustrate, the production of freon has been rising rapidly since 1980, peaking at 200,000 metric tonnes in 1985. Since then, however, its production began to fall to a great extent, reaching the bottom of 40,000 metric tonnes.
In contrast, the production of NO2 and H2O2 was markedly growing from 1990 to 2000, reaching 158,000 metric tonnes and 80,000 metric tonnes respectively, while both of them stabilized between 1985 and 1990.
To sum up, the production of NO2 and H2O2, which contributed to the damage of Anatarctic ozone hole, will continue growing, and that of freon seems to keep decreasing in the future.

_2020031.jpg
_2020031.jpg
