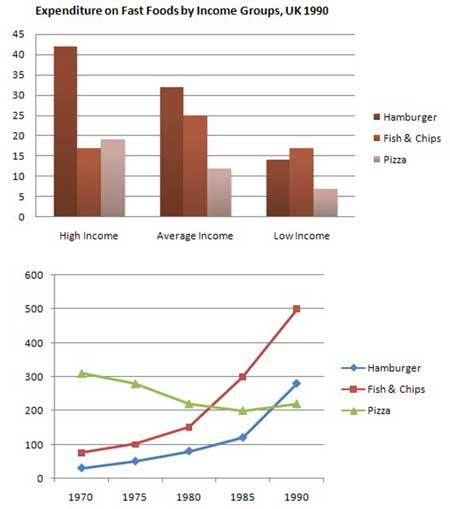
The chart below shows the amount of money per week spent on fast foods in Britain. The graph shows the trends in consumption of fast foods.
The bar chart and line graph illustrate the amount of money spent on fast foods classified by citizens' earnings and the number of its consumption during two decades in UK. At a glance, apart from fish and chips, people with high income dominate the number of expenses, meanwhile from 1970 to 1990, two kinds of the fast foods experienced a considerable rise.
With more than 40, hamburger far dominated people's expenditure in high level income, twice higher than the other food. Those earning average only outnumbered the figure for the former in fish and chips at 25, 7 times higher than the amount of money spent by high level earners on some food. Spending the lowest rate on both hamburger and pizza, the low level income showed the same rate of fish and chips as people with high income salary had.
Meantime, for the first decade, fish and chips showed its number of consumption rising steadily to 150 and it rocketed by 350 for the following decade. Similarly, occupying the lowest rate in the first year, hamburger saw an increase of 270. By contrast, over the 20-year period, the trend of pizza fell dramatically to 210. Even though it increased during the last five years, it did not offer a significant difference.

14639619_12993338567.jpg
