Hi everyone,
Please check out my essay and give me some advice. Please feel free to give corrections, I would more appreciate it if you score my essay. I am really thankful for all of you who help me improve my IELTS writing skills.
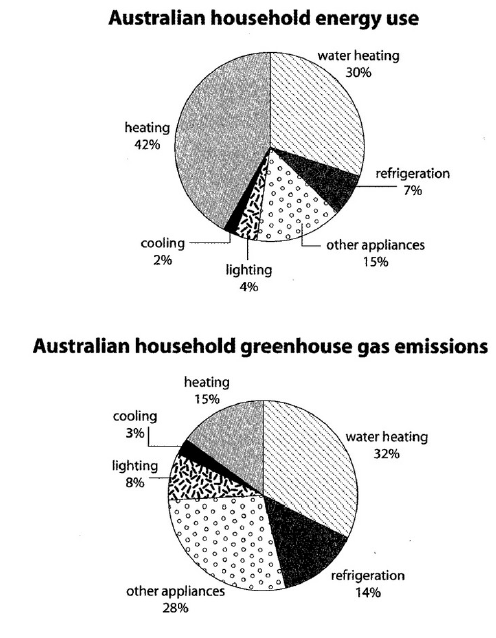
The first chart below shows how energy is used in an average Australian household. The second chart shows the greenhouse gas emissions which result from this energy use.
Generally, the two biggest usages of household energy use are heating and water heating, while water heating and other appliance both play pig role in greenhouse gas emissions.
We can see from the fist pie chart that in terms of energy use, heating accounts for the highest percentage in the six terms, which is 42%, and water heating occupies the second place at 30%. Although the percentage of refrigeration (7%) is smaller than other appliance (15%), it is still lower than the two percentage, cooling (2%) and lighting (4%). The percentage of cooling is the smallest that the percentage of heating is 21 times bigger than it.
On the other hand, the percentage of water heating plays the biggest part (32%) on the chart for greenhouse gas emission. Other appliance ranks the second position in the six aspects, which is followed by heating (15%) and refrigeration (14%). Cooling remains the smallest percentage (3%), and its percentage is much lower than lighting (8%). It is obvious that only in terms of heating, the percentage of energy use is bigger than greenhouse gas emissions, while the other five aspects have smaller percentages of energy use than greenhouse gas emissions
Please check out my essay and give me some advice. Please feel free to give corrections, I would more appreciate it if you score my essay. I am really thankful for all of you who help me improve my IELTS writing skills.
The first chart below shows how energy is used in an average Australian household. The second chart shows the greenhouse gas emissions which result from this energy use.
TASK1 - Australian energy household
Generally, the two biggest usages of household energy use are heating and water heating, while water heating and other appliance both play pig role in greenhouse gas emissions.
We can see from the fist pie chart that in terms of energy use, heating accounts for the highest percentage in the six terms, which is 42%, and water heating occupies the second place at 30%. Although the percentage of refrigeration (7%) is smaller than other appliance (15%), it is still lower than the two percentage, cooling (2%) and lighting (4%). The percentage of cooling is the smallest that the percentage of heating is 21 times bigger than it.
On the other hand, the percentage of water heating plays the biggest part (32%) on the chart for greenhouse gas emission. Other appliance ranks the second position in the six aspects, which is followed by heating (15%) and refrigeration (14%). Cooling remains the smallest percentage (3%), and its percentage is much lower than lighting (8%). It is obvious that only in terms of heating, the percentage of energy use is bigger than greenhouse gas emissions, while the other five aspects have smaller percentages of energy use than greenhouse gas emissions

20161129174033_583d4.png
