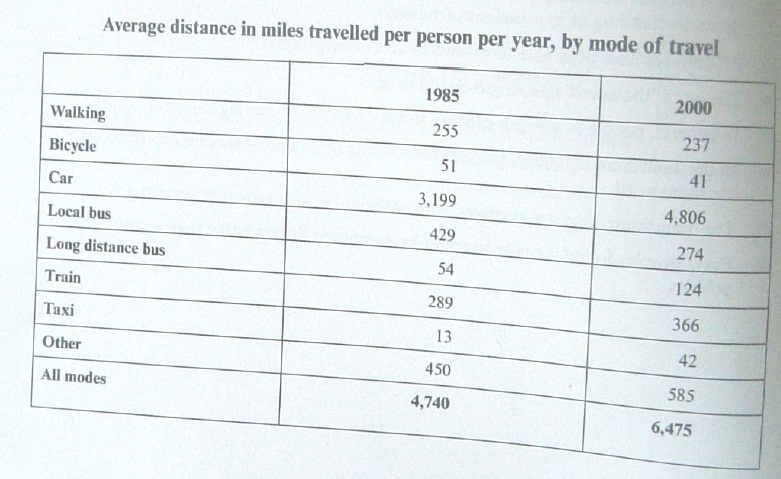
The table gives information regarding to the average distance in miles in 8 modes of travel in The United Kingdom from 1985 to 2000. Also, it is measured in per person per year.
Generally, what stands out from the table presents that the british people were more likely to travel in 2000 than 1985. Interestingly, there were 5 kinds of transportation experiencing an increase over the period, namely car, long distance bus, train, taxi and other. On other hand, showing an incline of average distance in England was walking, bicycle and local bus.
To begin with, the parent travelling by England people was by a car, representing by 3,199 miles in 1985 and 4,806 miles in 2000. However, the highest increase of average distance was train by 177 miles. With the same inclination experiencing a growth for the average distance in England, long distance bus, taxi and other were no less than 585 miles over the period.
Moving to more detailed analysis from the table reveals that the biggest decrease of average distance by people was local bus from 429 miles in 1985 to 274 miles in 2000. While the changes of walking decreased by 18 miles to 237 miles in 2000. 1985 to 2000 saw a slight decrease from 51 miles to 41 miles the average distance of England's citizens.

Untitled.jpg
