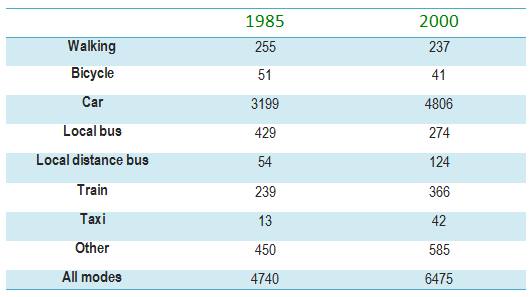
The table below gives information about changes in modes of travel in England between 1985 and 2000.
A breakdown of the average distance in miles how people move to somewhere else in England from 1985 to 2000, is depicted in the table. Overall, it can be seen that car experienced the most favorite transportation in both years, while taxi recorded the smallest in the first category year and bicycle in the rest year.
To begin with, the majority of transportation mode in 2000 was higher than in 1985. Firstly, car showed the highest distance of people at 4,806, while bicycle was the least popular at 41 in 2000. After that, taxi in 1985 showed at 13, while in 2000 recorded above three times higher in 2000.
On the other hand, there were a decrease in the number of transportation mode between 1985 and 2000. First of all, local bus appeared at 429 in 1985, while it was smaller at 274 in 2000. There was a drop in the distance of bicycle by 10 at 41, while local bus had the greatest drop by 155 in 2000.

Question
