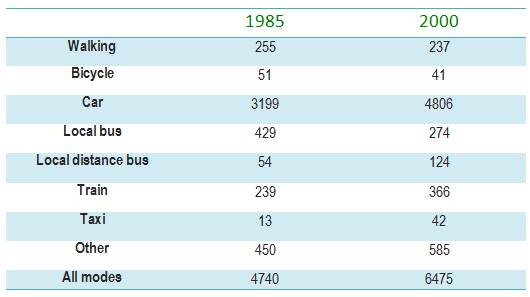
Average distance per person per year. The table below gives information about changes in modes of travel in England between 1985 and 2000.
A breakdown about the number of distance of modes of transport that is used of people in England over 15-year period, begin at 1985 is measured in miles and presented in the table. Overall, it can be seen that, car was the popular modes of travel over that period, and there was upward trend regarding changes of all modes of transport.
to begin with, in 1985 was the smallest proportion than others. It experienced the average distance per person just 13 around four-fold smaller than local distance, bus and bicycle. On one hand, car was the most popular than local bus and other as much as 3199 far bigger than both of them which just under 500. Besides, walking and train witnessed the number of distance no more than 300.
Secondly, in 2000 there was down ward trend in three modes transportation. It is shown by bicycle, local bus and walking just under 300, while others was a rapid increase. The most popular over this period was car at 4806, while the second popular was other at 585. So, it witnessed the number of all modes increase dramatically from 470 to 6475. However, taxi was a small rise by 22 and train from 239 to 366.(206w).

15327590_10202233035.png
