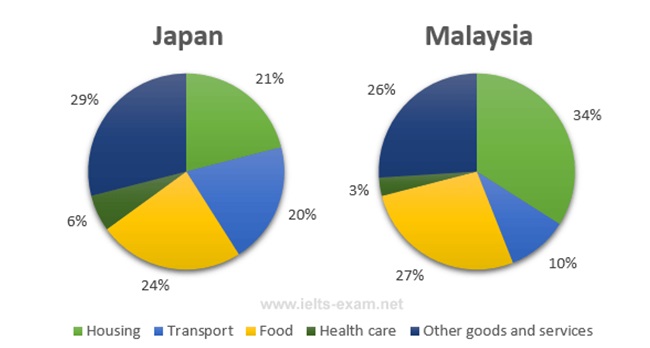
A breakdown of the percentage of money spending in household necessities in two Asian countries in the year 2010 is shown in the two pie charts. Overall, it can be seen that the largest proportion of household expenditures in Japan was noted in other goods and services. While the highest percentage of Malaysia's expends was witnessed in housing.
The three greatest proportion in both countries occurred in other goods and services, food, and housing. Whereas the majority part was taken by housing of Malaysia, which was at almost more than a third. Then, the most money that Japan's spending was other goods and services, at around less than a third. Additionally, the second highest percentage witnessed in food expenditures in both countries, which were noted at 27% in Malaysia, and Japan experienced below this point.
Less money spending in the average household expenditures was seen in transport and health care. Malaysia witnessed one in ten in transport aspect and 3% of health care, while Japan spent more money than Malaysia, which was two times in both aspects.

3.jpg
