the pie charts report
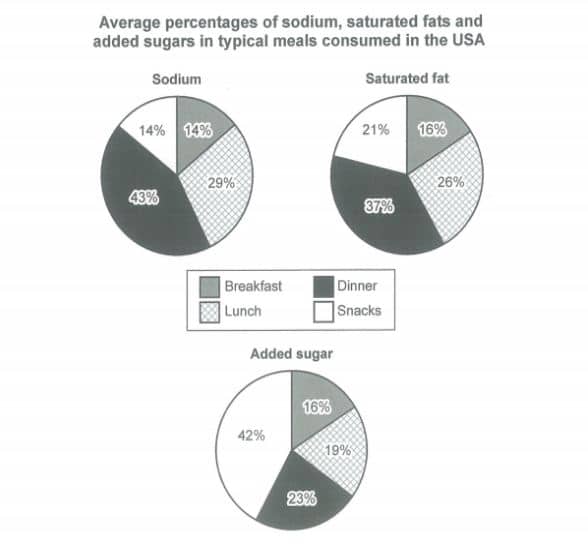
The charts below show the average percentages in typical meals of three types of nutrients, all of which may be unhealthy if eaten too much.
Summarise the information by selecting and reporting the main features, and make comparisons where relevant.
Answer:
The pie charts illustrate the percentage of three nutrient types: sodium, saturated fat and added sugar, which may be unhealthy if consumed excess certain proportion, in four main meals. The data is collected from the USA.
It is noticeable that sodium and saturated fat are mostly contained in dinner meals, while snacks have the highest percentage of added sugar compared to other meals. Breakfasts seem to be more healthy since their percentage of all three nutrients are at the lowest levels.
Compared to other meals, breakfast meals contain the lowest percentage of sodium, saturated fat and added sugar with 14%, 16% and 16% respectively. Sodium and saturated fat have comparatively large proportions in lunch meals with 29% and 26% respectively, while its added sugar level is lower just at 19%.
In the USA, eating dinner may be unhealthy because dinner meals contain a high percentage of all three types of nutrients. Specifically, in comparison with other meals, the percentage of sodium and saturated fat are at the highest level with 43% and 37% respectively. Although the added sugar proportion is not the highest among the typical meals, 23% added sugar is consumed by eating dinner. Finally, while snacks contain insignificant percentages of sodium and saturated fat with just 14% and 12%, added sugar is mostly consumed, up to 42%, when people eat this type of meal.
(Words: 226)

task1test1cam14.jpg
