computer ownership stats
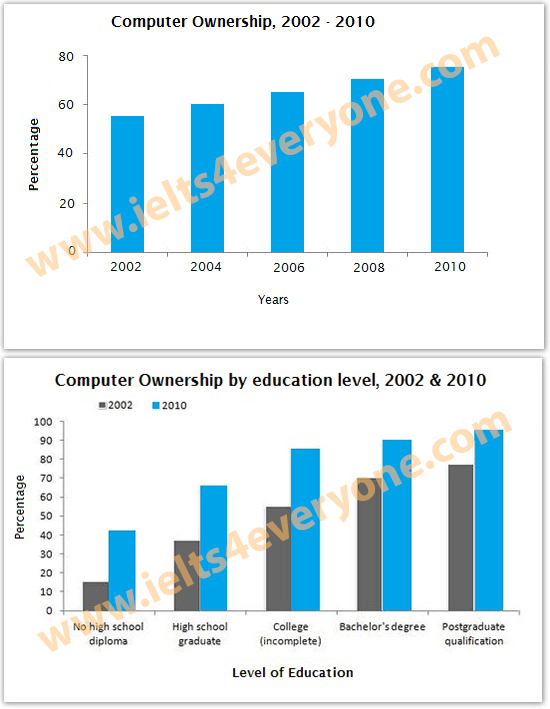
Task 1: The graphs below give information about computer ownership as a percentage of the population between 2002 and 2010, and by the level of education for the years 2002 and 2010.
The bar charts depict the percentage of computer ownership in terms of population and educational level in an eight-year period, starting from 2002.
Generally, both the proportion of computer possession by population and level of education witnessed an upward trajectory throughout the given period. Additionally, regarding the educational background, people with no high school diploma possessed the least percentage of computers, while the opposite was recorded in the figure of those having postgraduate qualifications.
Concerning the data of people owning computers based on the population, approximately 60% of the population possessed computers in 2002. During the next eight years, this proportion experienced a considerable growth until reaching its highest point at around 75% in 2010.
Regarding the statistics of the other criteria, people under university level owned nearly a quarter percent (no high school diploma) and 70% ( high school graduates) correspondingly. Compared to those who had not completed their college courses with 80% of computer ownership, people having different kinds of qualifications, in particular bachelor's and post graduate's degree possessed nearly 100%.

Academic_IELTS_Writi.jpg
