Unanswered [0]
  

Home / Writing Feedback   % width   Posts: 3


IELTS 1: The bar chart depicts data about how many tons of waste was collected by recycling centre


lequelamcute 1 / 1  
Sep 5, 2021   #1

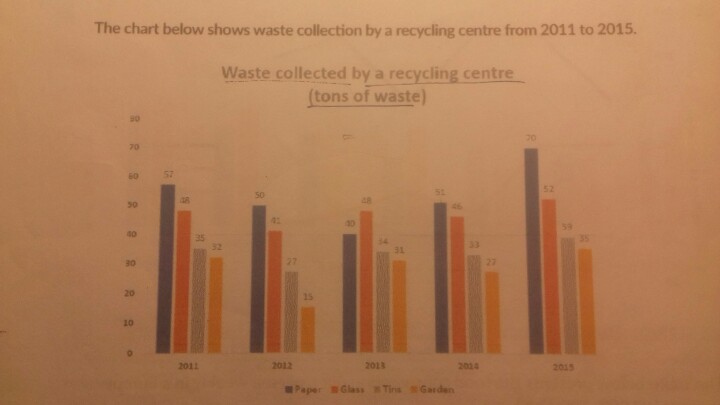
The chart below show waste collection by a recycling centre from 2011 to 2015


The bar chart depicts data about how many tons of waste was collected by recycling centre between 2011 and 2015, namely in paper, glass, tins and garden.

Overall, what stands out most from the graph is that waste of garden always ranked final position among four mentioned type of waste and all of waste consistently fluctuated over 4-year period.

It can be clearly observed that in 2012 the number of tons of garden nearly halved about 15 tons to nearly 30 tons, compared to those of garden in 2011 and 2013. Following that the amount of paper in 2012 was roughly equal to those in 2014, at approximately 51 tons, whereas in 2015 the number of paper reached the highest point of 70 tons over the course of four year.

It could be noticed that the number of tins remained almost constant from 2013 to 2015, but was higher than those of garden. There are some significant changes in amount of glass from 2011 to 2015 which hit low of 46 tons in 2014.

Thanks for reading my essay^^

  • 905e78f3ece21abc43f3.jpg


Holt  Educational Consultant - / 15466  
Sep 7, 2021   #2
between 2011 and 2015

Not "between" but "from". Use "between" when referring to a 1:1 discussion. "From" indicates a wider discussion covering more than a 1:1 reference. This statement needs a wider comparison reference point based upon the image.

tons of garden

Garden what? Use more synonyms for garbage and waste. You are displaying a very weak vocabulary and grammar range at this point. The same applies to the other waste references. This type of essay is synonym usage intensive. Build a better vocabulary to accomplish this. Read more English print materials and watch more English films. Throw in vocabulary building exercises as well. The lack of synonym usage makes the presentation confusing and difficult to understand.
OP lequelamcute 1 / 1  
Sep 8, 2021   #3

Thank you alot for your constructive comment^^ It really helps me ^^ Wish you have a nice day ^^


Home / Writing Feedback / IELTS 1: The bar chart depicts data about how many tons of waste was collected by recycling centre
ⓘ Need Writing or Editing Help?
Fill out one of these forms for professional help:

Best Writing Service:
CustomPapers form ◳

Graduate Writing / Editing:
GraduateWriter form ◳

Excellence in Editing:
Rose Editing ◳

AI-Paper Rewriting:
Robot Rewrite ◳