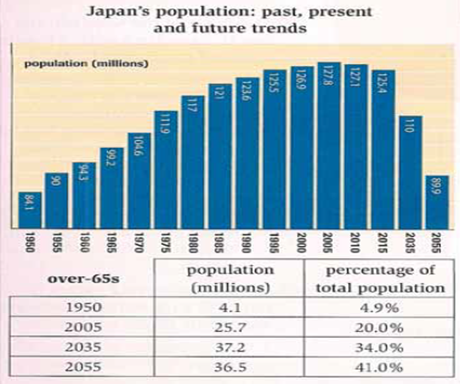
A breakdown of Japanese citizens measured in millions is illustrated in the bar chart, whilst the table displays the percentage of people aged 65 and more from 1950 to 2025 as the projected year, a 150-year period. Overall, the number of people living in this country is predicted to decrease significantly after a gradual rise, but the total of old population will show an upward trend.
To begin, the rate of Japanese inhabitants stood at 84.1 million in 1950. This rate went up dramatically to 121 million in 1985, nevertheless it saw a gradual increase over the following 20 years. Before declining to 125.4 million in present year, the figure peaked at 127.8 million in 2005. Afterwards, this figure will fall sharply in the end of period.
On the other hand, the proportion of elderly people in Japan was just 4.1% in early period. This proportion became virtually fourfold in 2005. Next, it is forecast to climb considerably during the next years in which this will rise to 34% and 41% respectively in 2035 and 2055.
The chart and table below give information about population figures in Japan.

New_Picture.png
