Here is another ielts writing task 1 sample.
Please someone check the description.
_____
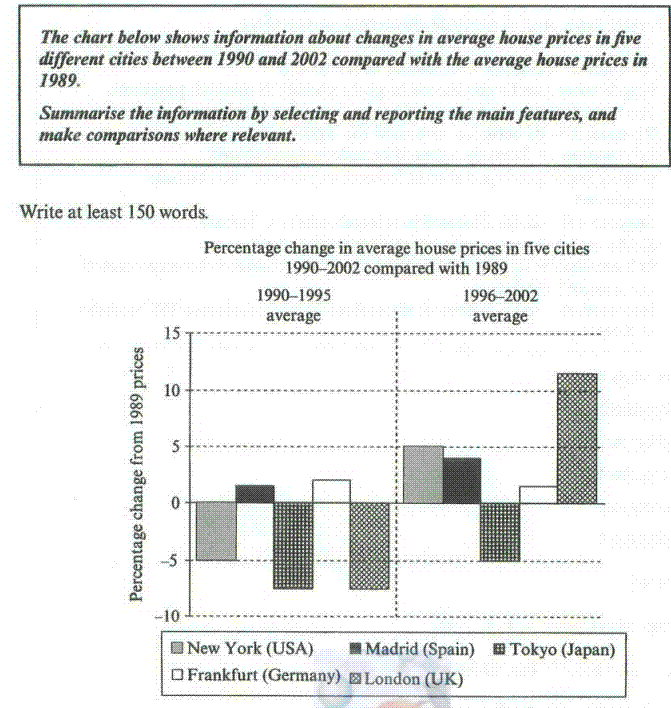
The bar chart compares figures for changes in avarage real-estate prices between 1989 and the period of 1990 to 2002 in five different cities.
It is clear from the chart that in the period of 1990 to 1995, the prices for houses in three out of five given cities were 5% down, compared to these in 1989.
It is also obvious that this trend reversely changed between 1996 and 2002, when four out of five cities showed an increase in avarage house prices comparing with the year 1989.
New York and Tokio house prices bottomed out to 14%, as did the house prices in Tokio, but by 5% down. Only Frankfurt and Madrid showed an increase to 2% and 2,5% resprectively, compared to 1989.
The situation changed radically for almost all given cities between 1996 and 2002, when New York, Madrid, Frankfurt and London showed 5%, 4%, 1,5% and 12% rise in avarage house prices , in comparison with 1989.
Interestingly, that only Tokio's figures were down during both given periods, compared to 1989.

wtask2_1.GIF
