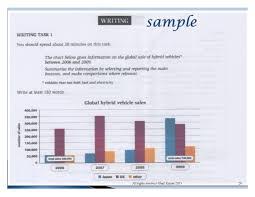
The bar chart illustrates the number of hybrid vehicle sold in Japan, United States and other countries from 2006 to 2009, a 4-year period. Overall, it can be seen clearly that the sales of this vehicles climbed significantly over the timeframe. In this case, United States displays the highest number of modern vehicles' sales, while others present a reverse.
To begin, there was 360,000 innovative vehicles were purchased by people in the world in 2006. This rate became more than twofold in 2009. Next, the majority of buyers come from United States. Initially the rate of hybrid vehicles' sales in this country was only 250,000. This rate rose dramatically by 100,000 in 2007. Afterwards, This felt slightly to 300,000 in the following year, but went up again to approximately 325,000 in 2009.
By contrast, the figure for the newest model of vehicles' sales in Japan stood at 50,000 in 2006. This figure was similar to other countries at the same time. Over the following two years both figures went up gradually. Furthermore, it increased rapidly to nearly 300,000 in Japan in the end of period whereas that was virtually unchanged in other regions in the same year.

6f862d05cd90426d9.jpg
