Unanswered [1]
  

Home / Writing Feedback   % width   Posts: 3


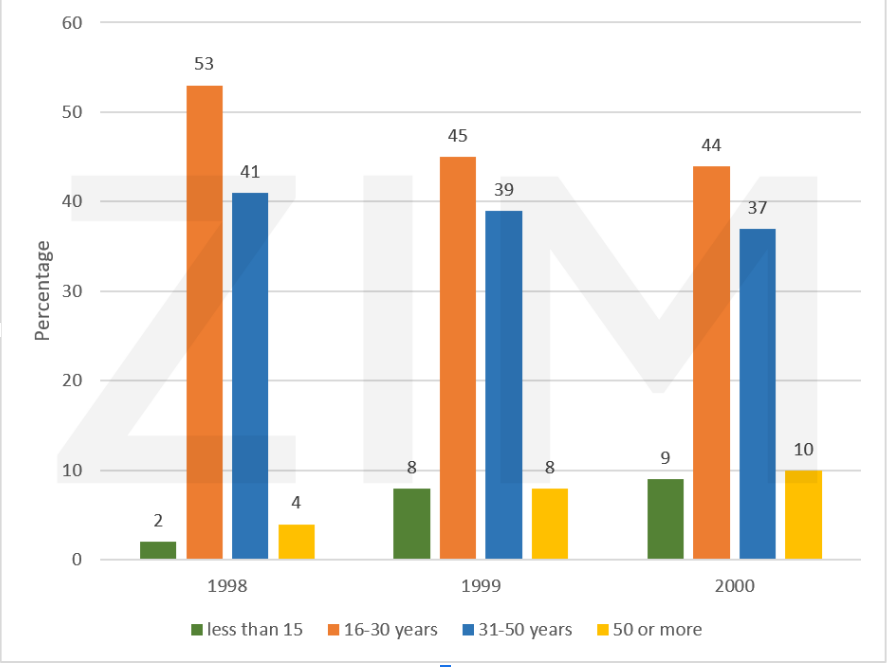
Writing 1: The bar chart shows mobile usage in a country by age group from 1998 to 2000.


phamthao0710 1 / -  
Nov 18, 2022   #1

mobile users by age


The given bar graph illustrates the proportion of citizens utilizing mobile in a nation by distinct age brackets between 1998 and 2000
Overall, the rate of mobile usage in the 16 to 50 years old was highest while that of people less than 15 was lowest during this given time. It is noticeable there was an increase in the proportion of mobile usage less than 15 and more than 50, but the opposite was true for remaining age groups.

In 1998, 53% of mobile users were aged 16 to 30, which held the leading position. Meanwhile, the percentage of citizens utilizing mobile in the 31 to 50 age bracket was 36% higher than that of people over 50, at 4%. Followed by 2% of mobile users less than 15, standing at the lowest position.

From that time onwards, while this number of mobile users less than 15 and from 16 to 30 years old stayed unchanged, the proportion of mobile usage in the 31 to 50 aged bracket underwent a slight decline of 37% in 2000. In addition, a minimal growth was recorded in the inhabitants more than 50 years old in 2000.

  • Screenshot2022111.png


Holt  Educational Consultant - / 15460  
Nov 18, 2022   #2
Since there are several positions for a bar chart, the writer should be position specific about the image identifier. By being position specific, that means he needs to differentiate between a vertical and horizontal bar graph. This will help the reader get a better perspective of how the image was presented for analysis. He also forgot to identify how the measurements were procured for the survey (in percentage) as a part of the information summary. So the infomation short presentation will be deemed as incomplete.

The overall problem the writer has is that he is focused on presenting the information as quickly as possible, without considering the clarity of the report and the connectivity between information comparisons. His tendency is to just get over with the information presentation, disregarding the clarity and comprehension requirements of the C+C scoring section. As such the overall essay is really confusing and difficult to follow for the average reader who, as implied by the reporting style, does not have a copy of the image to base the understanding of the analysis presentation on.

With regards to the writing skills in this presentation, the writer has shown a limited ability when it comes to sentence formation, grammar range, and punctuation usage. He should try to present more advanced sentence structures and more variation when it comes to punctuation usage. There are other punctuation marks that can be used aside from a comma and a period. Using only those 2 punctuation marks tend to lead to lower GRA scores due to limited sentence styles.
DanielDang 5 / 8  
Nov 19, 2022   #3
you forgot to add "the" before the "highest" and the "lowest". These faults of grammar will decrease your overall score.


Home / Writing Feedback / Writing 1: The bar chart shows mobile usage in a country by age group from 1998 to 2000.
ⓘ Need Writing or Editing Help?
Fill out one of these forms for professional help:

Best Writing Service:
CustomPapers form ◳

Graduate Writing / Editing:
GraduateWriter form ◳

Excellence in Editing:
Rose Editing ◳

AI-Paper Rewriting:
Robot Rewrite ◳