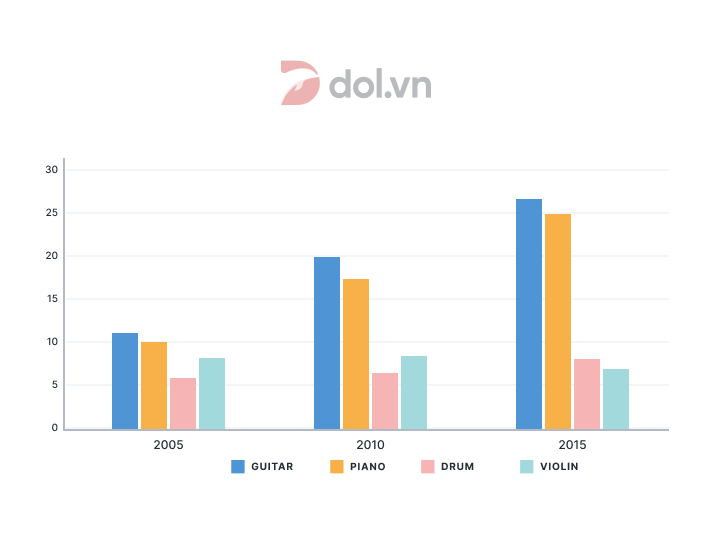
The bar charts illustrate how the proportion of school children who learn to play 4 distinct musical instruments varied in 3 separate years : 2005, 2010, 2015.
Overall, piano, drums and guitar witnessed an increase in the number of students, while violin learners rate decrease over the given period. Notably, the percentage of children who learn guitar reached the highest amount among those instruments.
The piano and guitar saw a remarkable growth throughout the given time frame. Initially, the participation of children learning piano was at the highest percentage, at 12%. Thereafter, there was an increase of 26% in the final year of the period. Similarly, guitar also experienced an upward trend, the proportion of guitar learners significantly grew by 30%, which reached its peak at 40% in 2015.
Moving on to the drums, its percentage stabilized over the period at about 5%, after which climbed slightly to 8% in 2015. Violin learners rate exhibited an opposite reserve trend, decreasing from 9% in 2005 to 5% at the end of the period. Owing to the gradual decline, this proportion was the lowest among those who learned other musical instruments.

110d5d7967a8427d9.png
