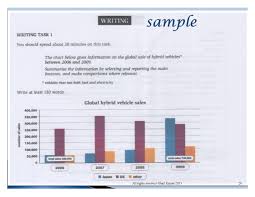
The chart below gives information on the global sale hybrid vehicles* between 2006 and 2009.
The bar charts present the trade of new model of private transportation from 2006 to 2009. Overall, the total sales in Japan, US and other countries were upward trend. The highest number of new car of high develop technology trade from united state county and followed by Japanese nations as a runner up.
The transportation trading in US stood at 250.000 in 2006. Then, in 2007 this reached a high at 350.000. Next, that decreased slowly by 30.000 to 320.000 in 2008. Afterwards, the commerce of transportation in US fell again to 300.000 in 2009.
It can be seen that, The number of trade vehicles in Japan was at 50.000 in 2006. Moreover, that increased gradually until 2008, in 2009, it rose significantly by 230.000 to 330.000 in 2009. That was the highest of sale vehicles compared with US and other nations in 2009. The number of sales in other countries increased steadily for over four years.
Overall, total trading was upward trend, from 360.000 in 2006 to 740.000 in 2009. Japan was the one of country which went up sharply more than 200.000 and it became the top sales private transport in 2009.

index.jpg
